The goal of this task is to use the Azure monitor. This includes setting diagnostic logging for resources, monitoring activity and creating performance graphs.
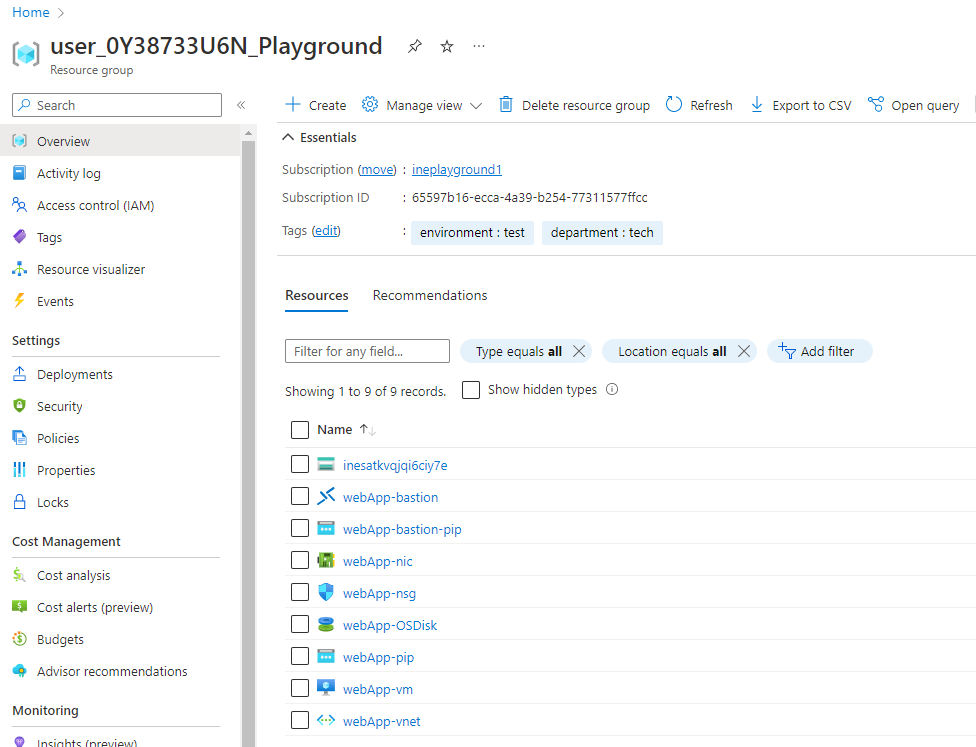
When you log in to Azure with the provided credentials, you will find all the required resources available in the resource group.
Note: Deployment of Bastion service will take some time.
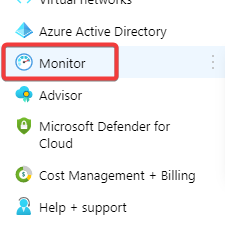
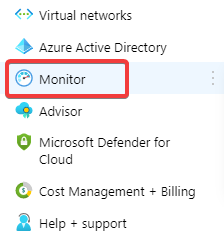
The portal menu lets you quickly get to key functionality and resource types. When the portal menu is in flyout mode, it's hidden until you need it. Select the menu icon to open the menu. Now click on Monitor.
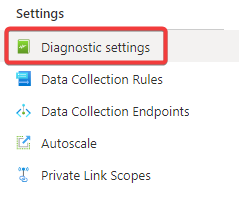
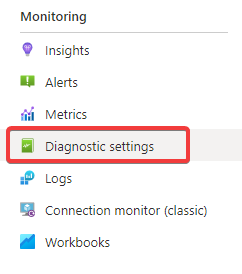
Now click on Diagnostic settings from the left navigation menu.
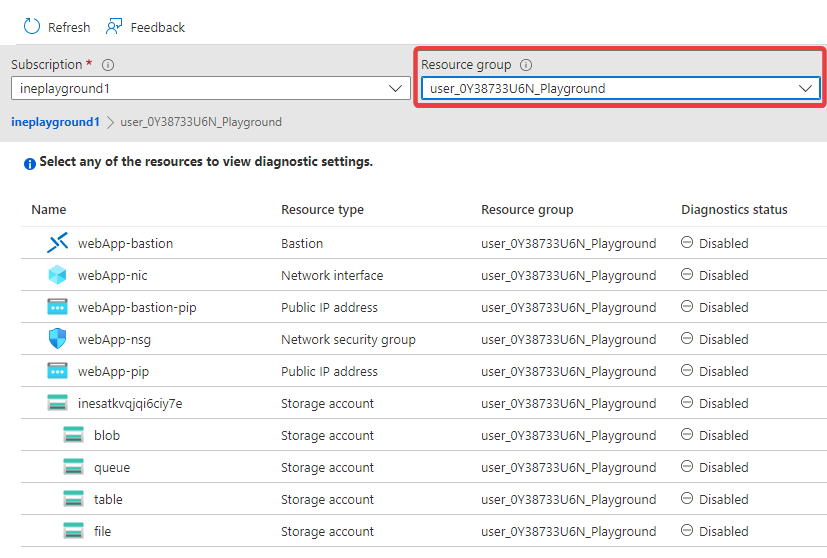
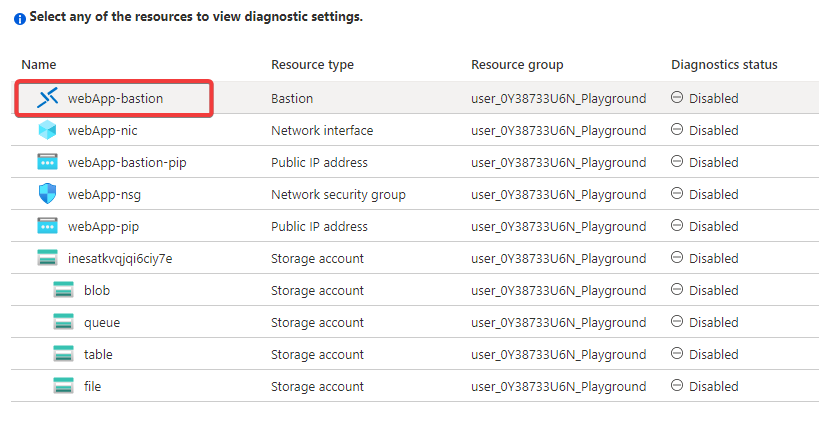
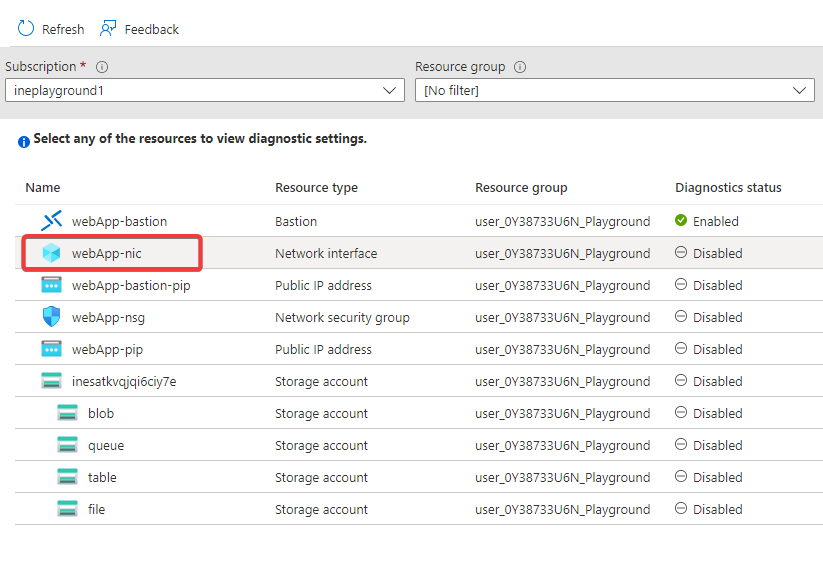
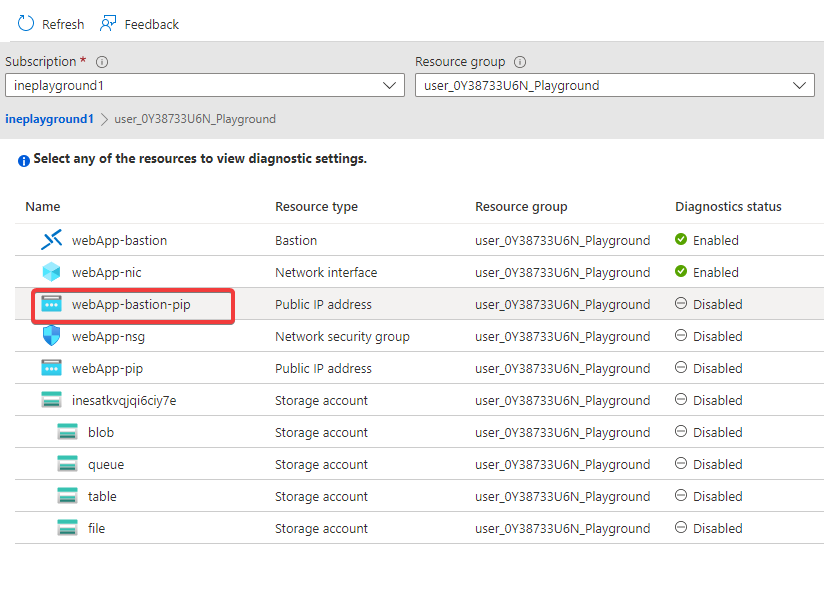
Select the provided resource group and filter out all other resources.
Click on WebApp-bastion.
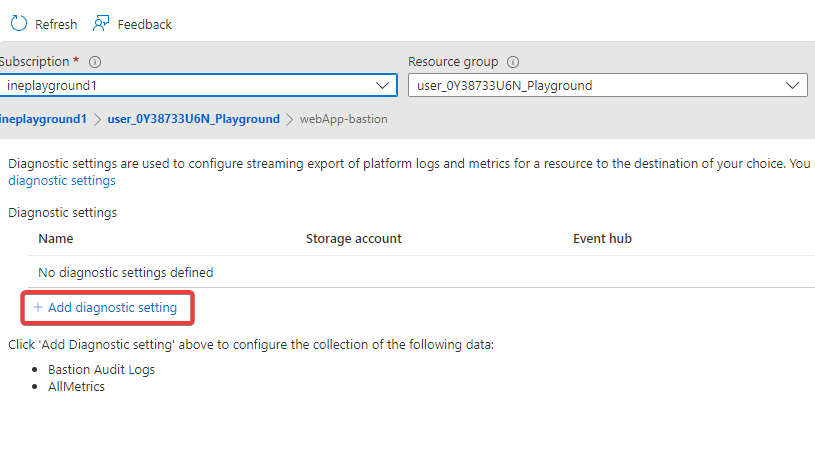
Click on Add diagnostic setting.
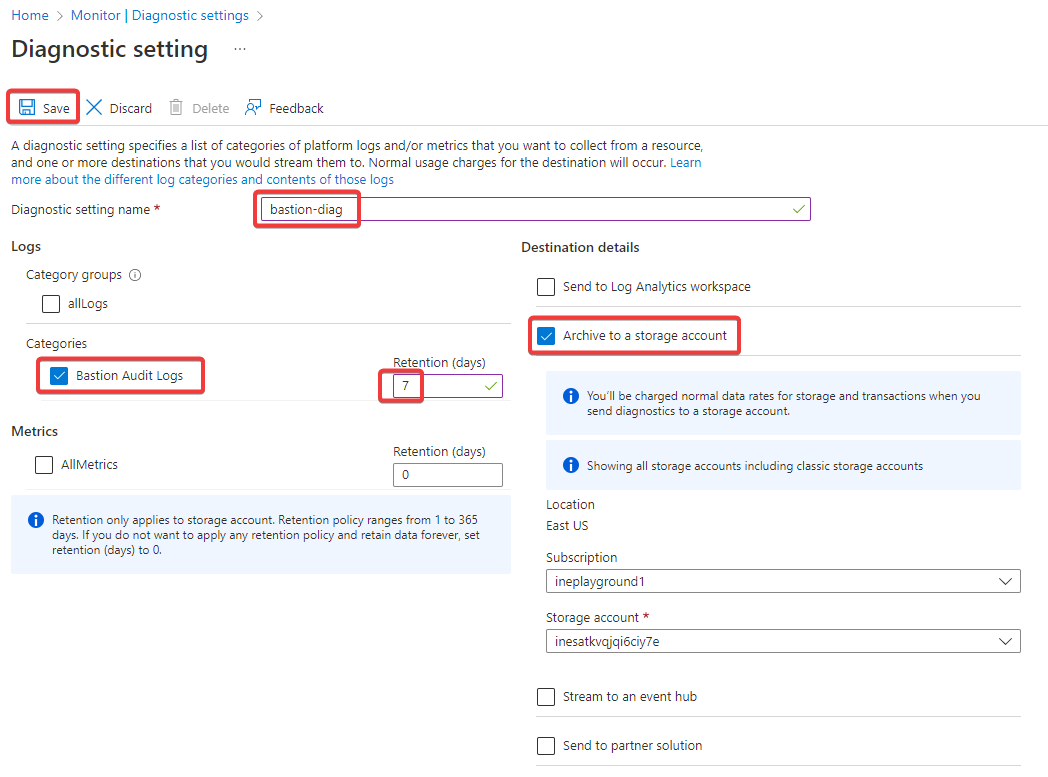
Configure the following settings and click on Save.
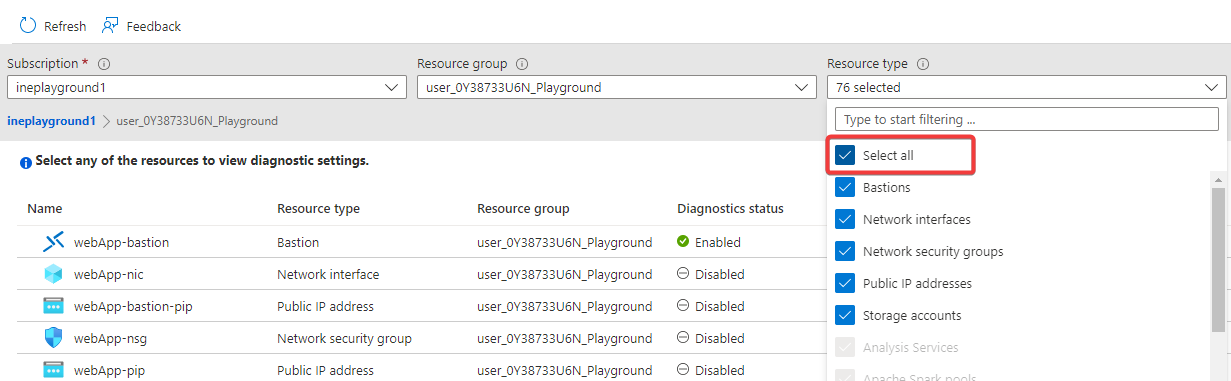
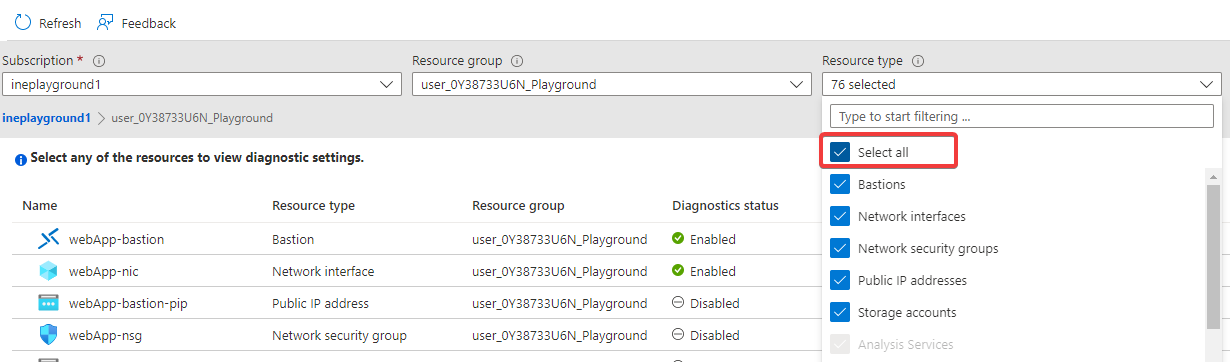
Navigate back to diagnostic settings page and set Select all in resource type.
Click on webApp-nic.
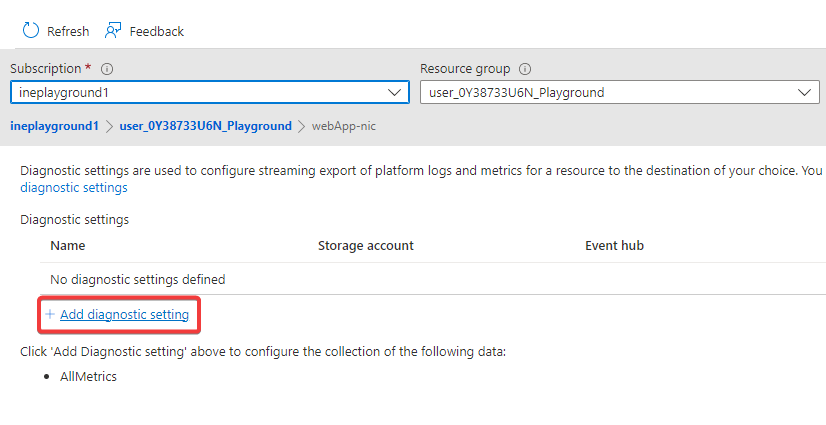
click on Add diagnostic setting.
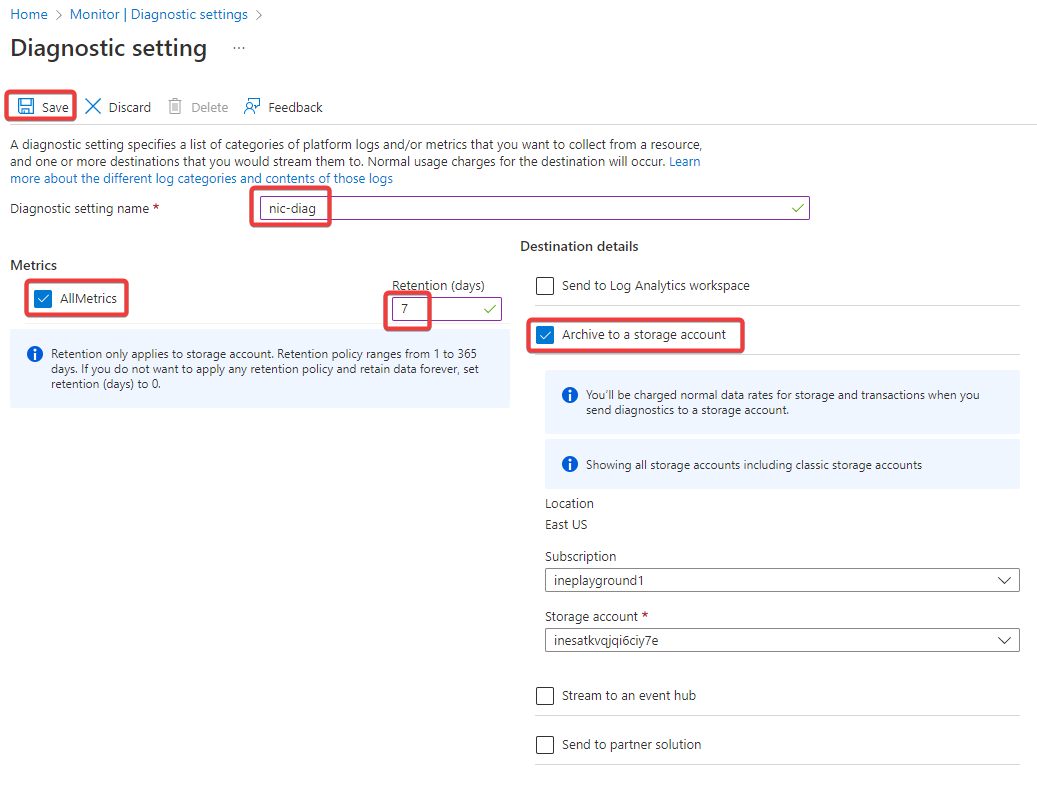
Configure the following settings and click on Save.
Navigate back to diagnostic settings page and set Select all in resource type.
Click on webApp-bastion-pip.
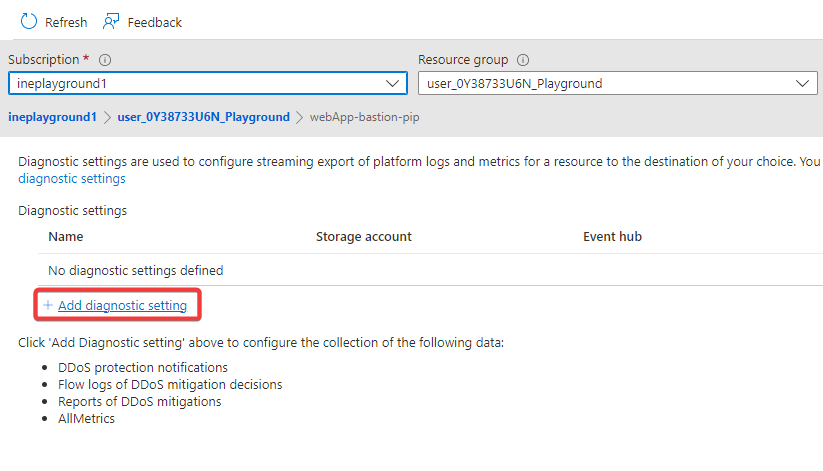
click on Add diagnostic setting.
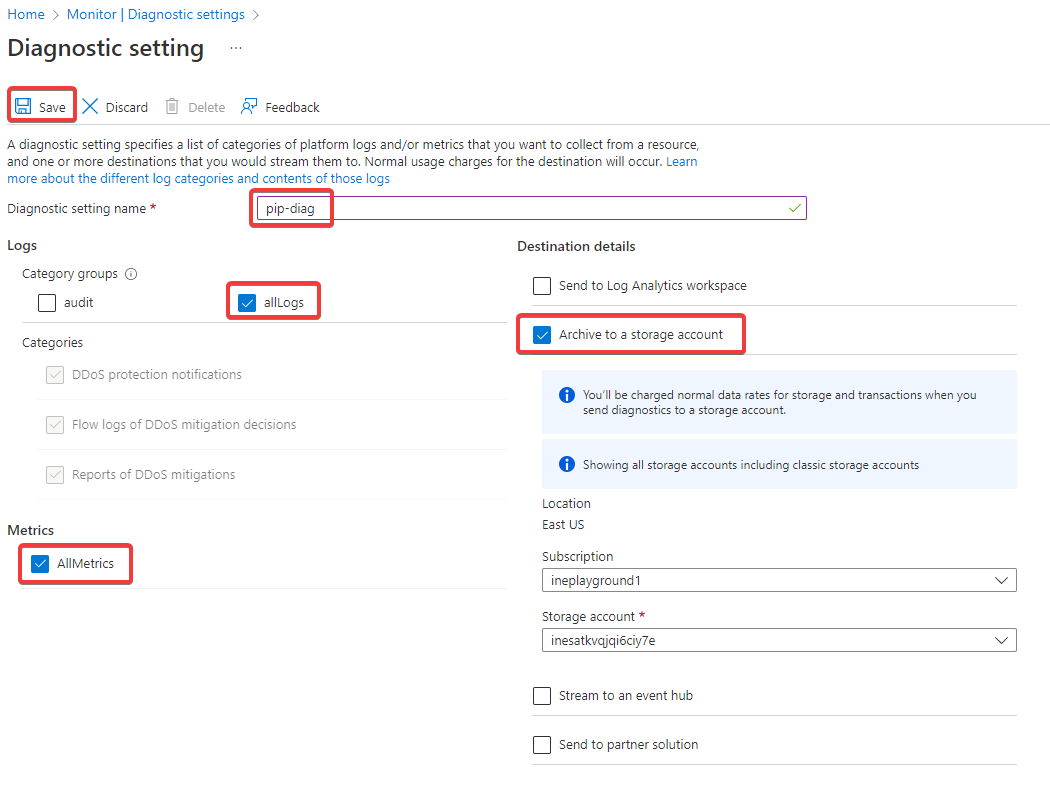
Configure the following settings and click on Save.
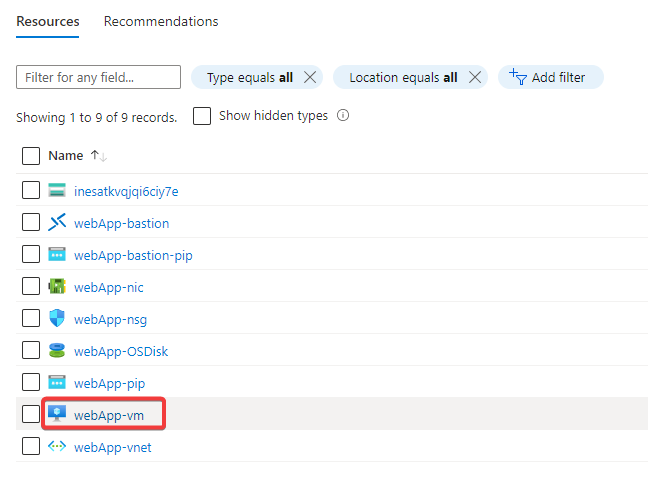
Navigate back to the resource group and click on webApp-vm.
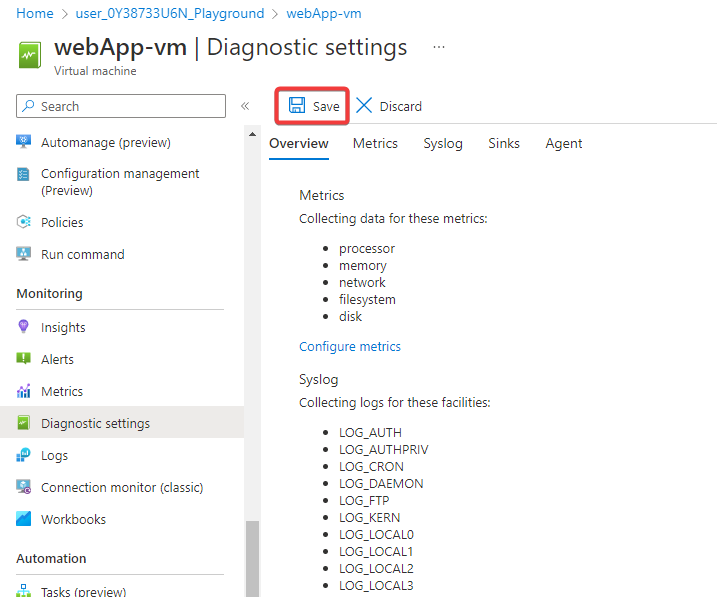
Click on Diagnostic settings.
Select the storage account and click on Enable guest-level monitoring.
Note: It will take some time to setup the monitoring agent.
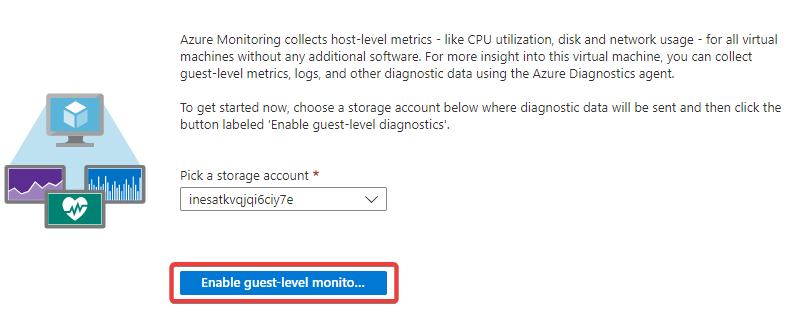
Once the setup is done, click on Save.
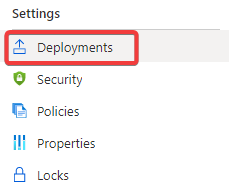
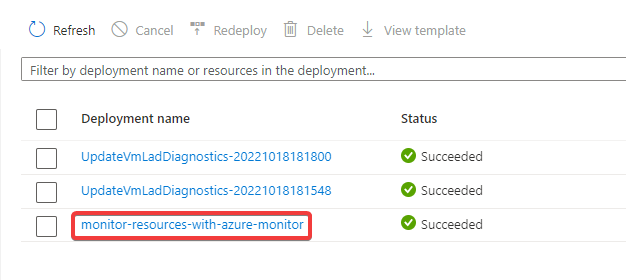
Navigate back to the resource group and click on Deployments.
Click on monitor-resources-with-azure-monitor.
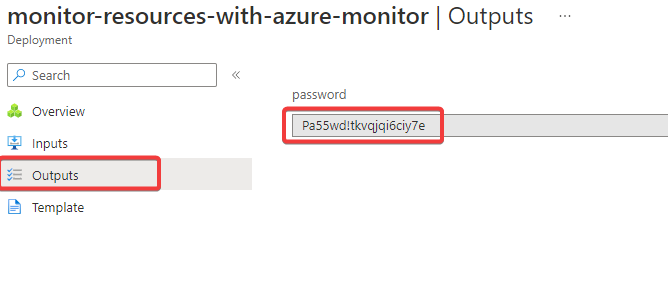
Now click on Outputs and copy the password.
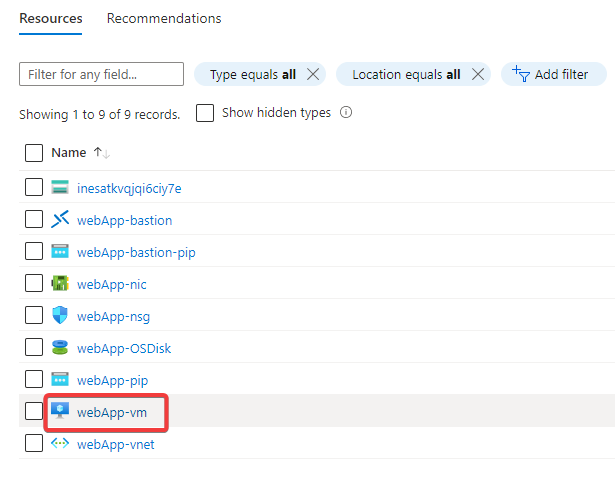
Navigate back to resource group and click on webApp-vm.
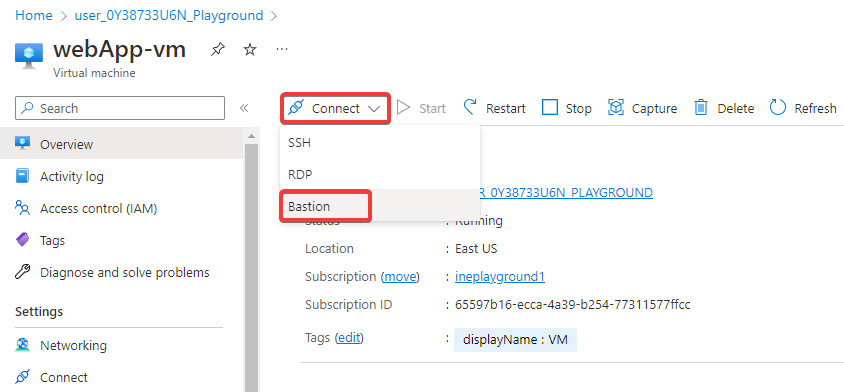
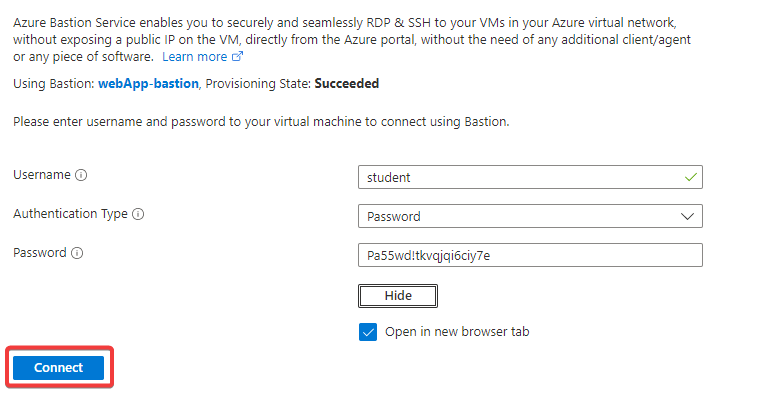
Click on Connect and select Bastion from the drop-down.
Enter the username and paste the password and click on Connect.
It will open a new tab in the browser.
Note: Allow the popup in the browser if it is blocking the portal to shift to a new tab.
Now execute the following commands to generate network traffic.
sudo apt-get update
sudo apt-get install -y nodejs
sudo apt-get install -y npm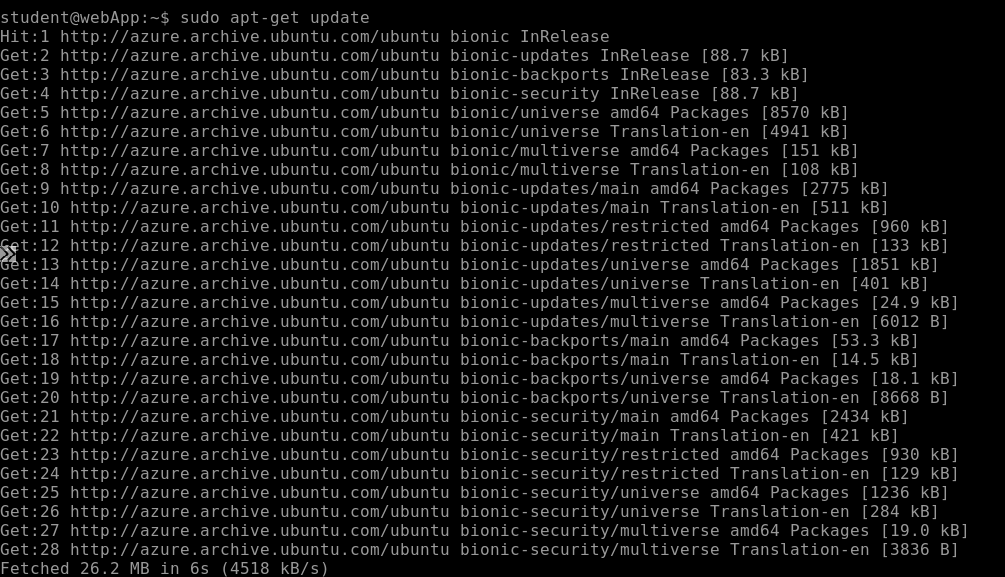
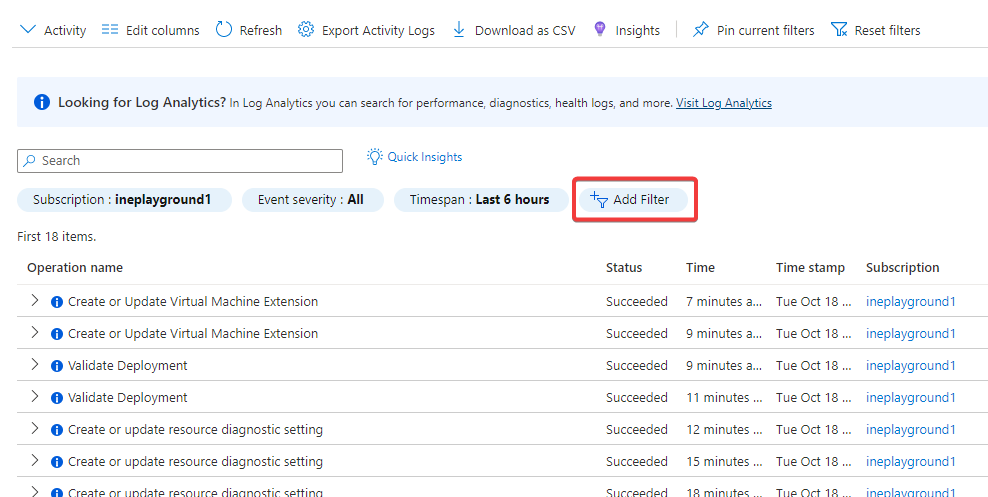
Select the menu icon to open the menu. Now click on Monitor.
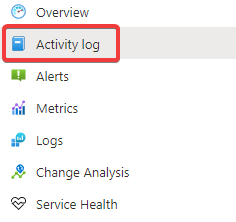
click on Activity log from the left navigation menu.
Now add filter to the logs by clicking Add filter.
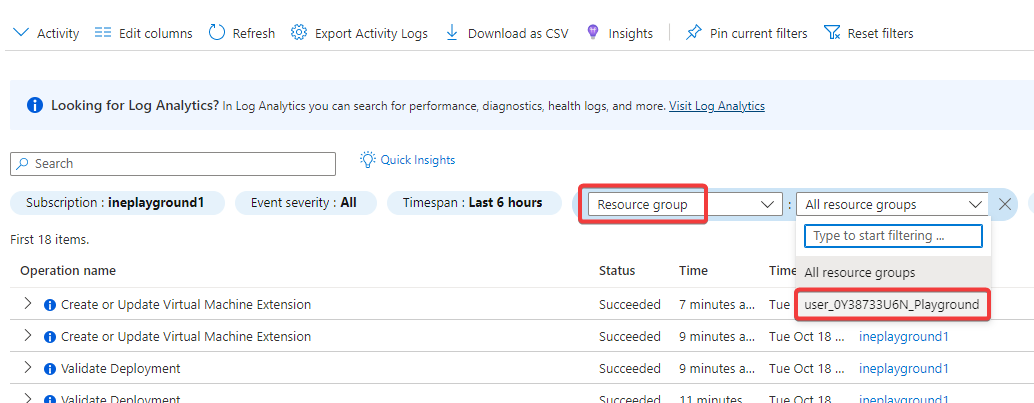
Choose filter type as Resource group and select the provided resource group.
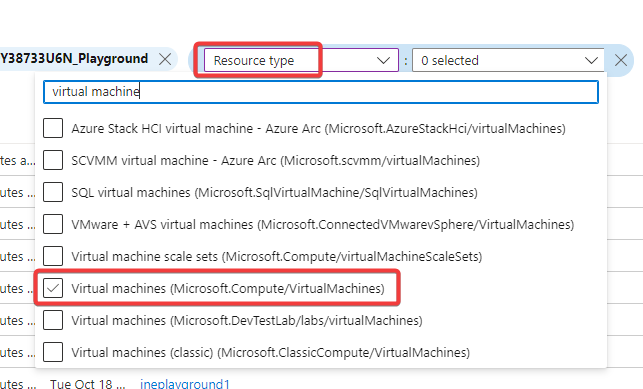
Now add a filter again and put filter type as Resource type. Search of virtual machine and select Virtual machines(Microsoft.Compute/VirtualMachines).
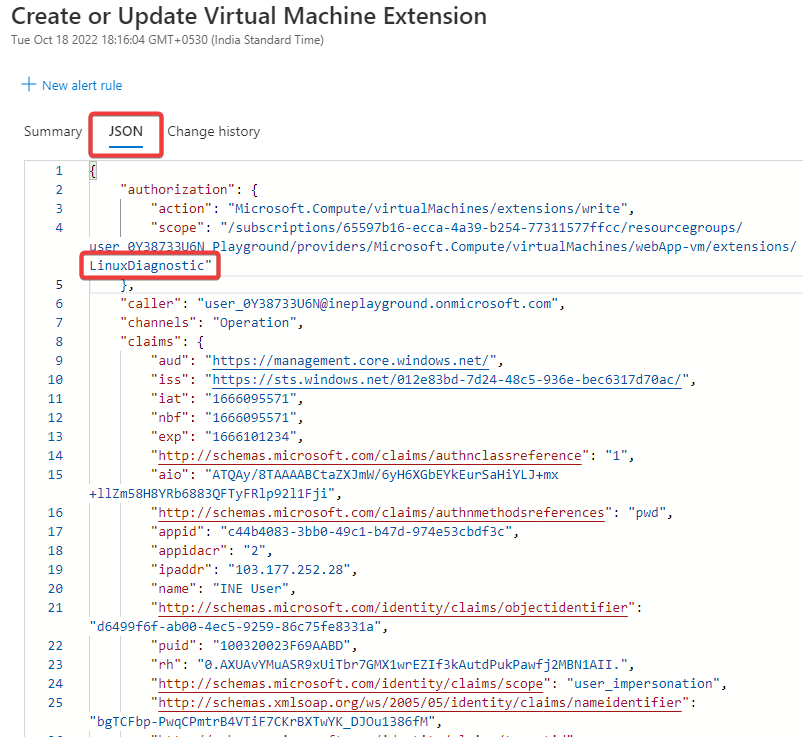
After setting these filters you will find the logs related to virtual machine. Now click on Create or Update Virtual Machine Extension.
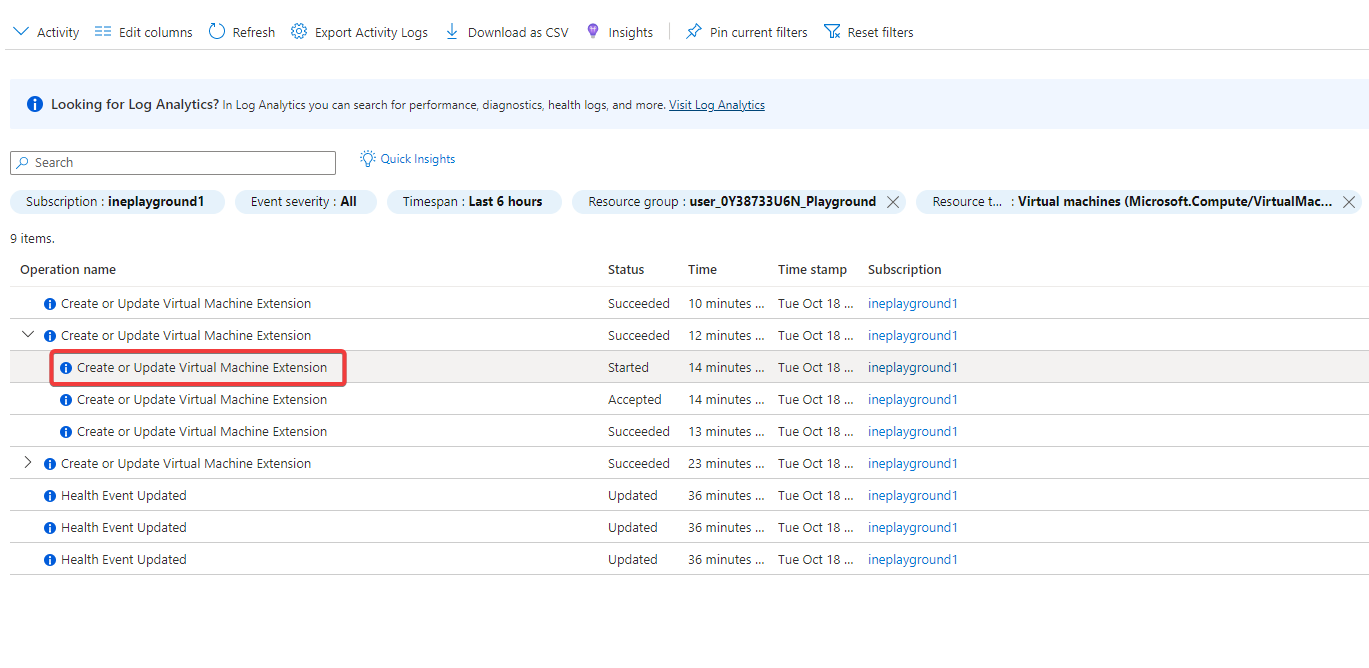
Select JSON and find LinuxDiagnostic. This JSON file will provide all the details of the operation performed in the virtual machine.
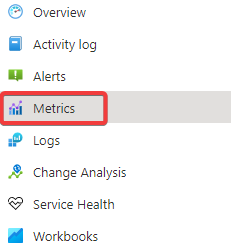
Click on Metrics in from the left navigation menu.
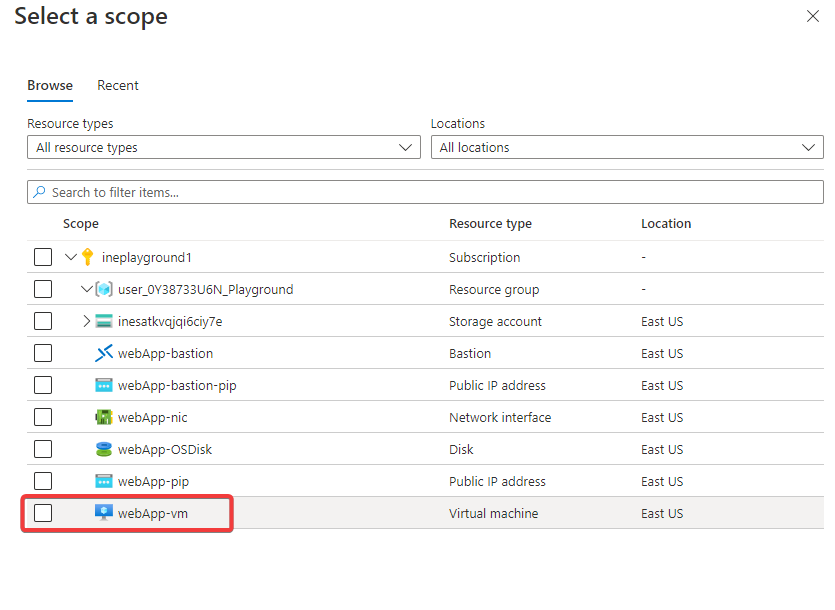
In the scope select webApp-vm under the provided resource group.
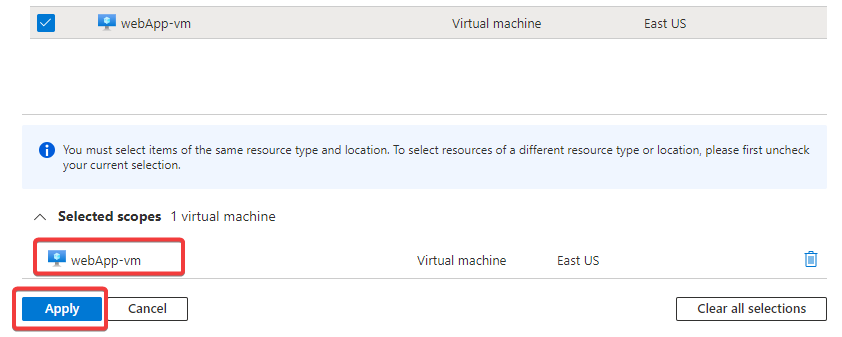
You will find webApp-vm in the selected list. Now click on Apply.
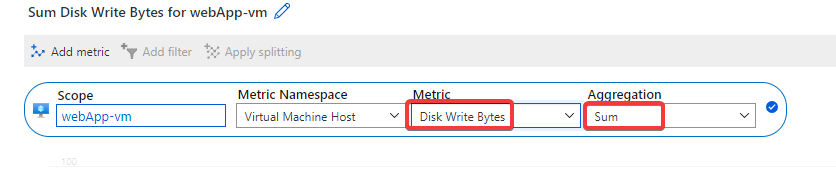
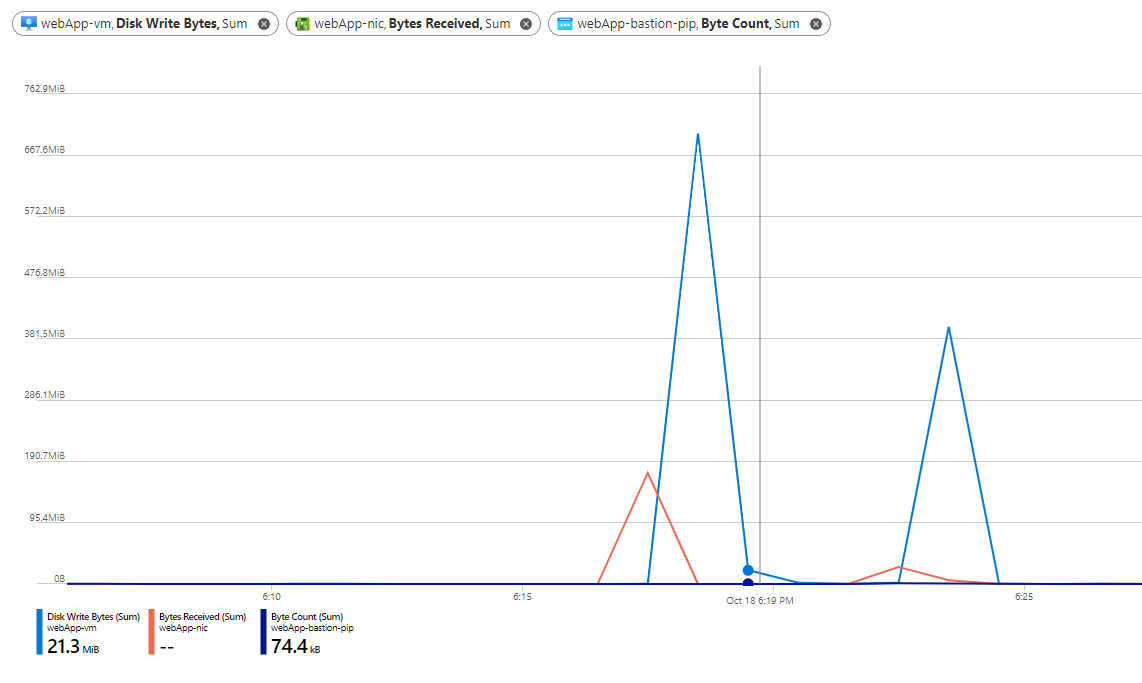
Set Metric as Disk Write Bytes and Aggregation as Sum. Click on tick after entering these settings.
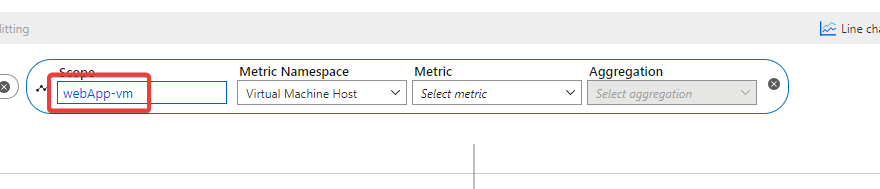
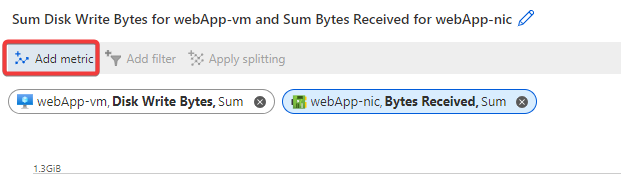
Now again add a metric by clicking Add metric.

Clik on the Scope.
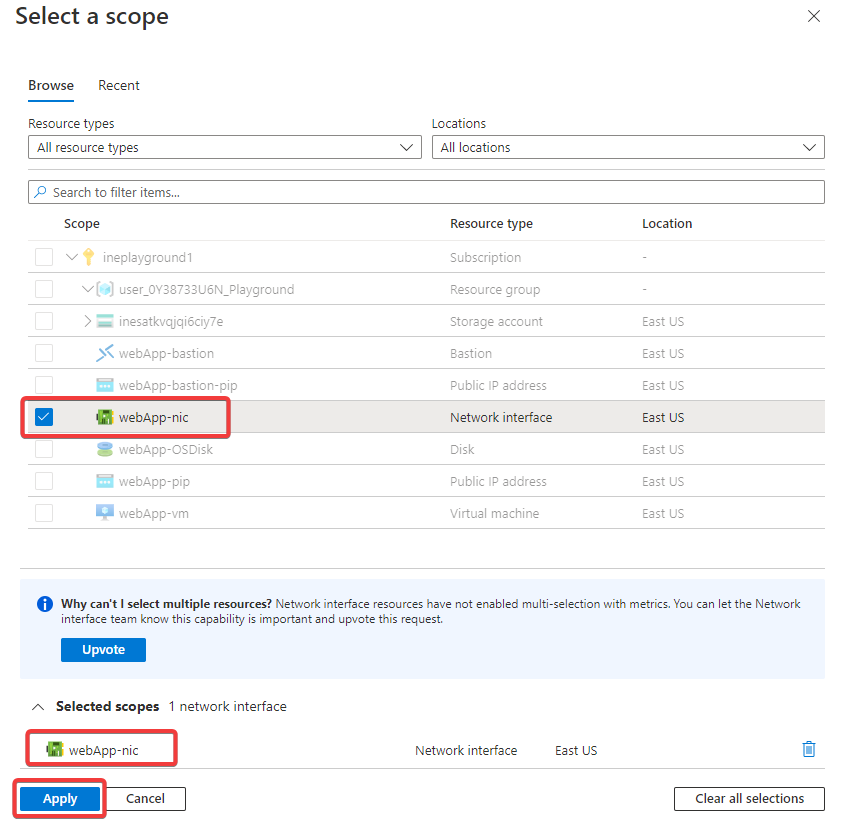
Select webApp-nic and click on Apply.
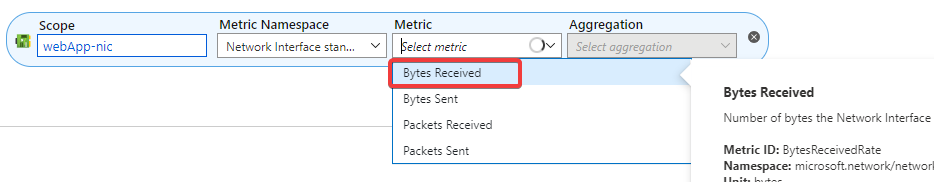
Set Metric as Bytes Received and Aggregation as Sum. Click on tick after entering these settings.
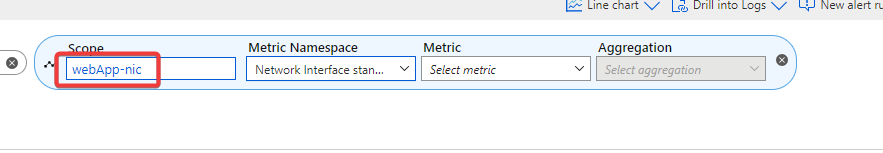
Now again add a metric by clicking Add metric.
Clik on the Scope.
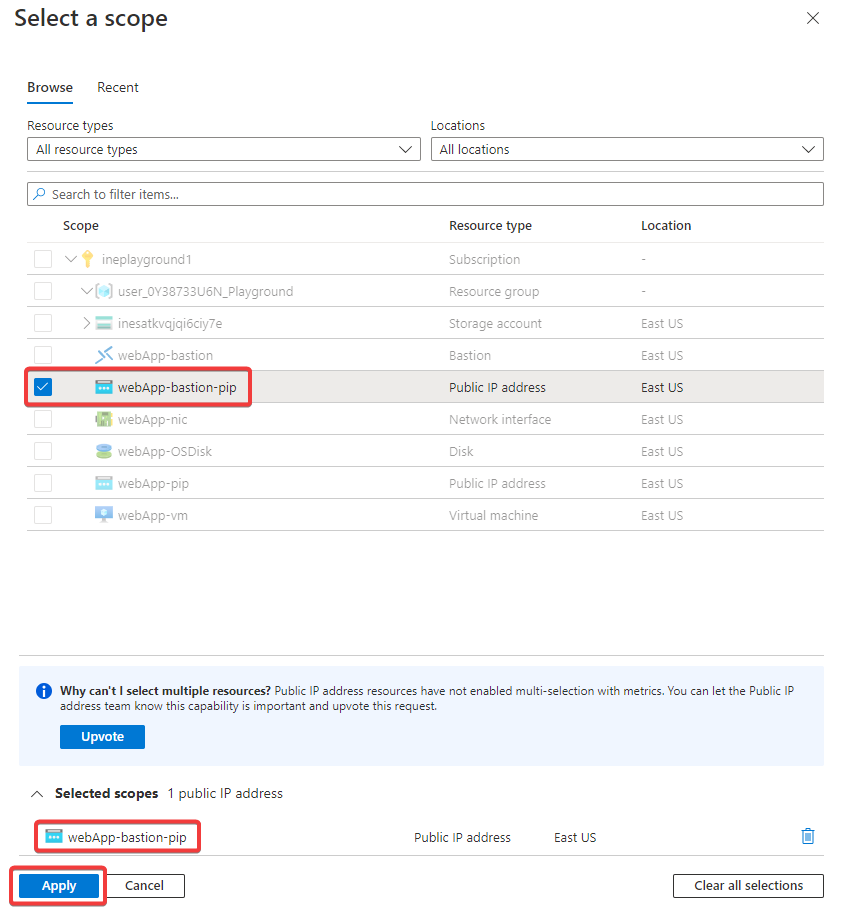
Select webApp-bastion-pip and click on Apply.
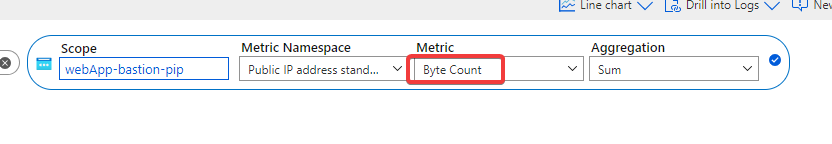
Set Metric as Bytes Count and Aggregation as Sum. Click on tick after entering these settings.
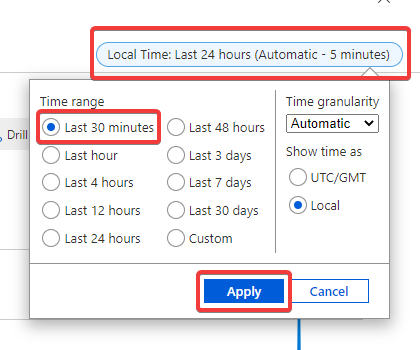
Click on Local time and set time range as Last 30 minutes. Click on Apply
You will now find a graph displayed in the portal similar to this.
Our lab is now complete.