Use log analytics workspace to analyze diagnostic and performance data.
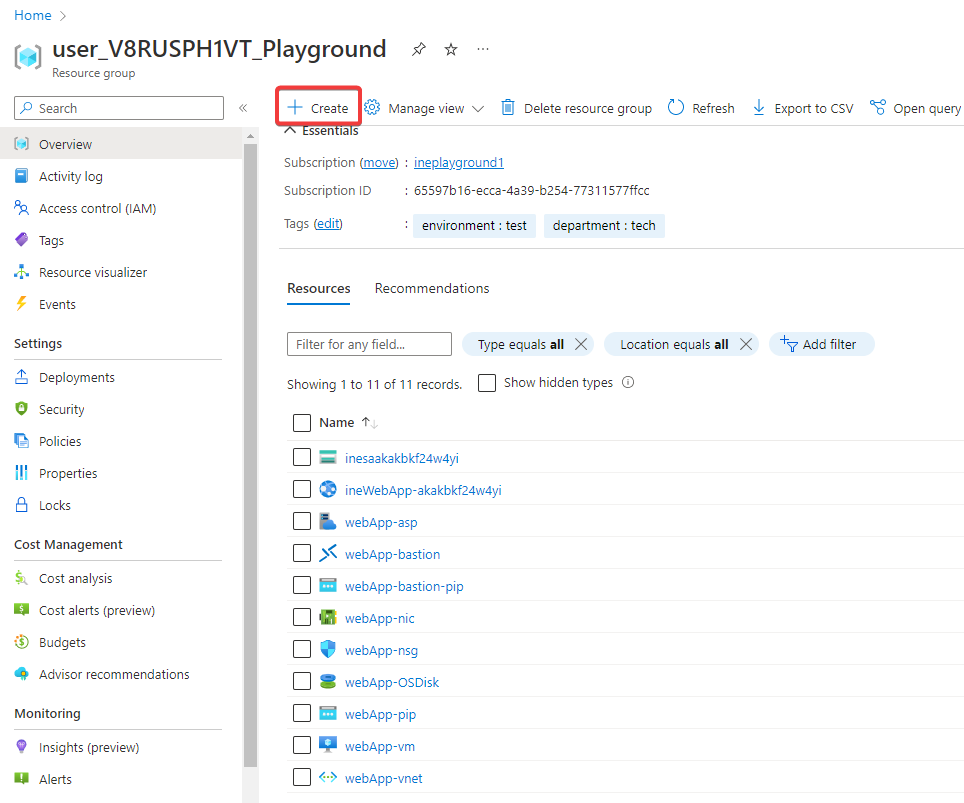
When you log in to Azure with the provided credentials, you will find all the pre-requisite setups available in the resource group. Now click on Create.
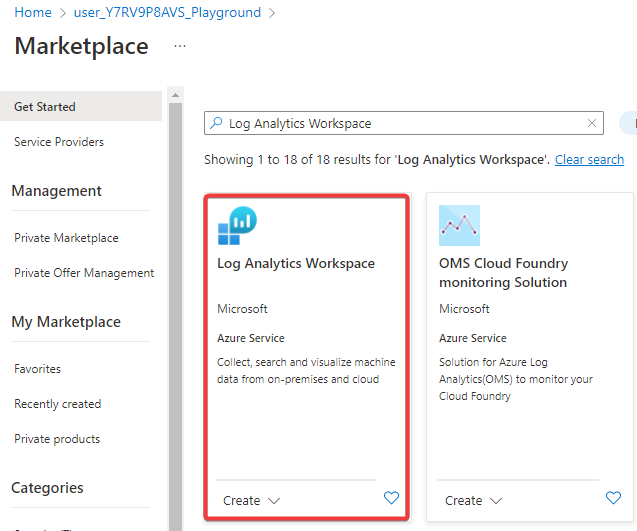
Search for Log Analytics Workspace and click on it.
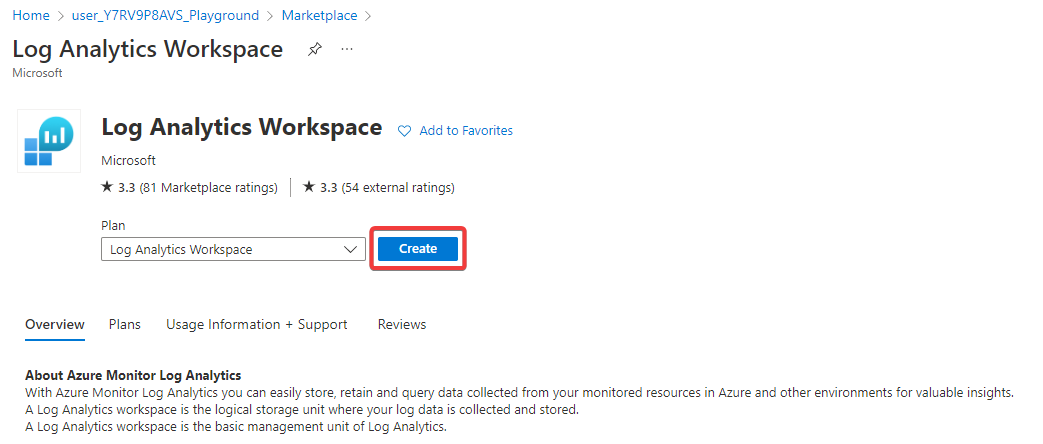
This page will provide an overview of the Log Analytics Workspace. Now click on Create.
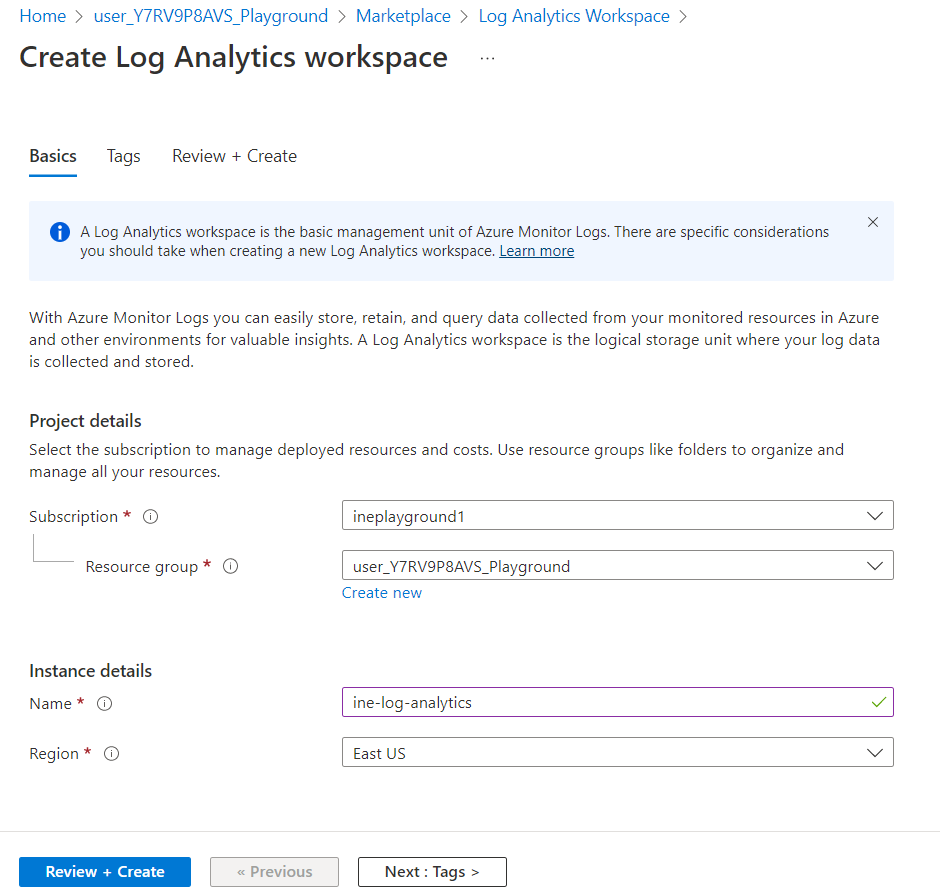
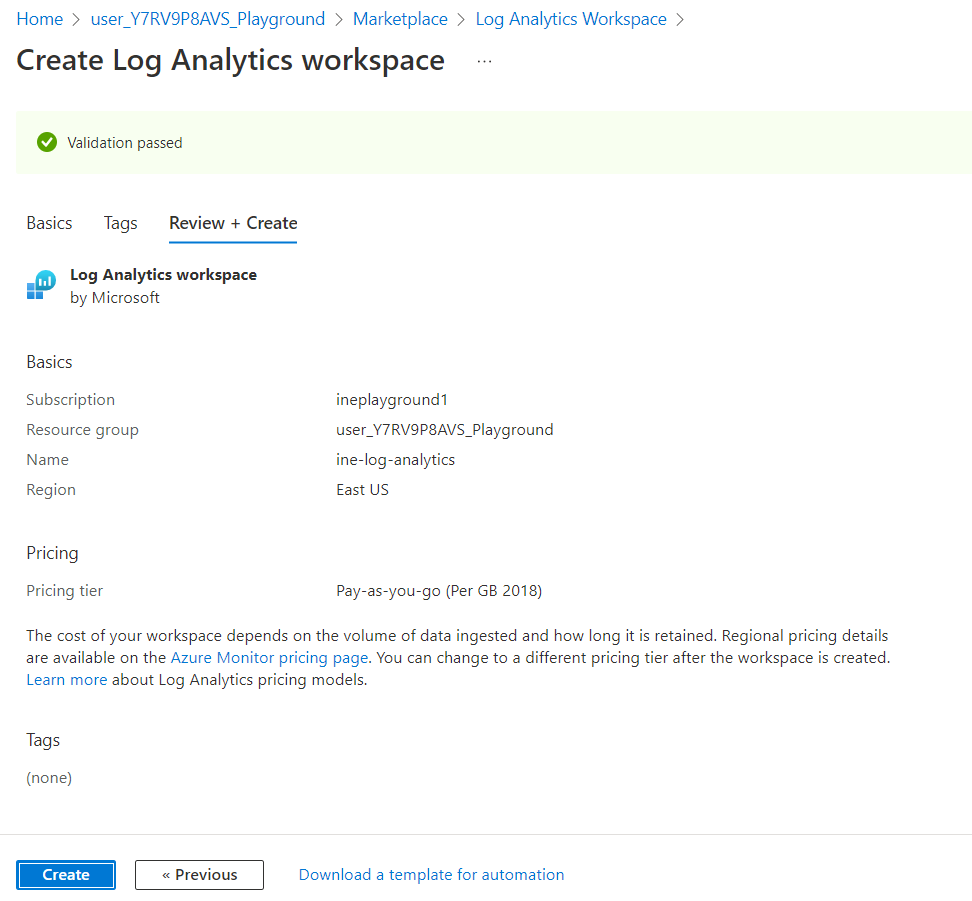
Set any unique name to the Log Analytics workspace and click on Review + Create.
Review the configurations and click on Create.
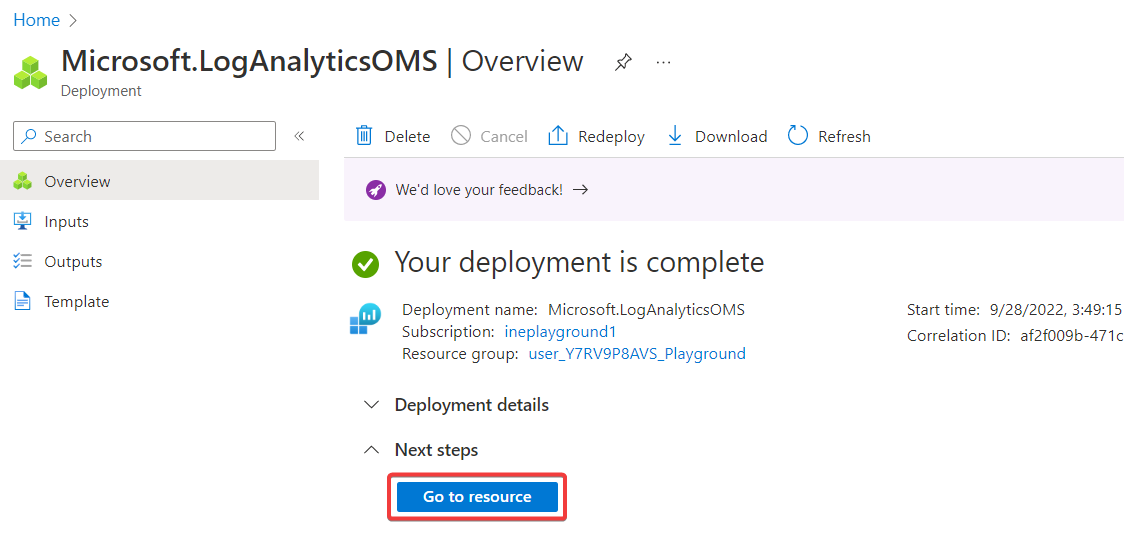
Successfully deployed Log Analytics workspace. Now click on Go to resource.
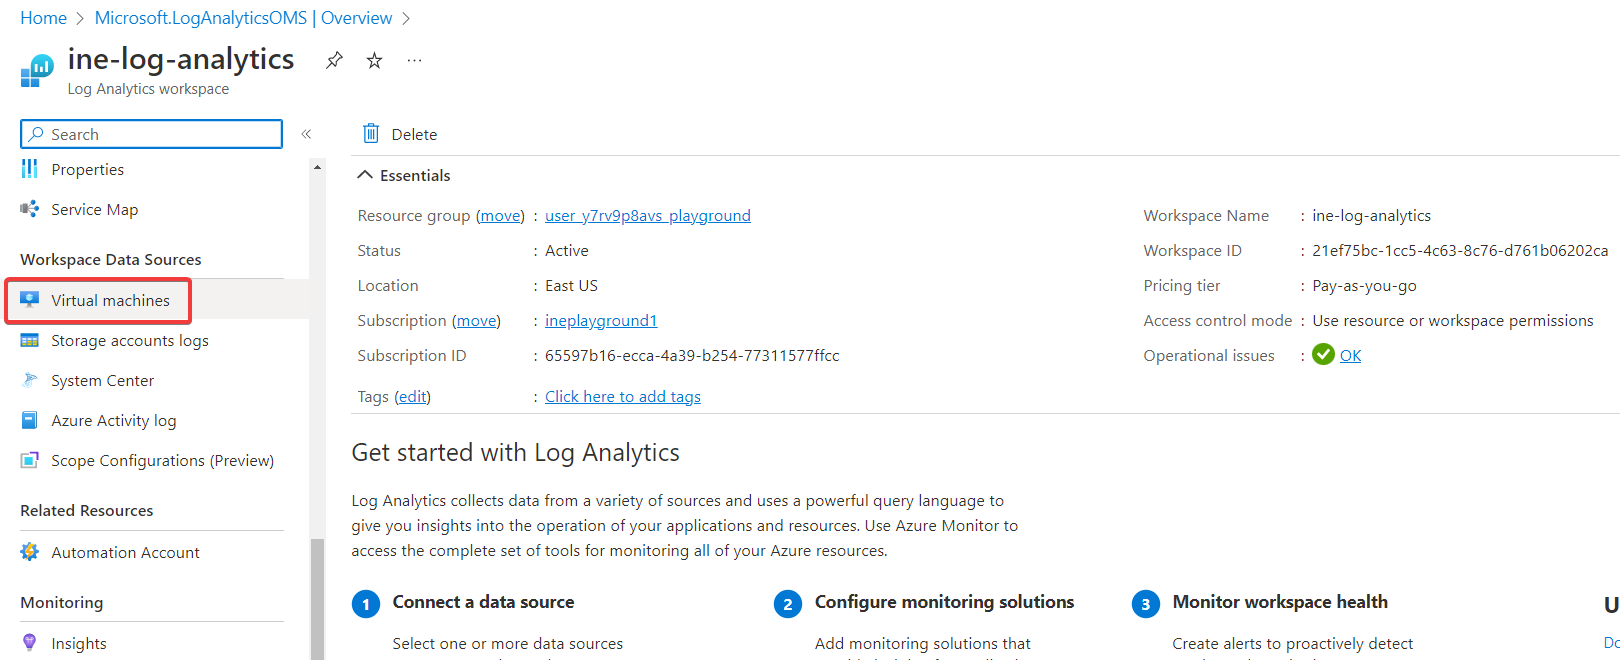
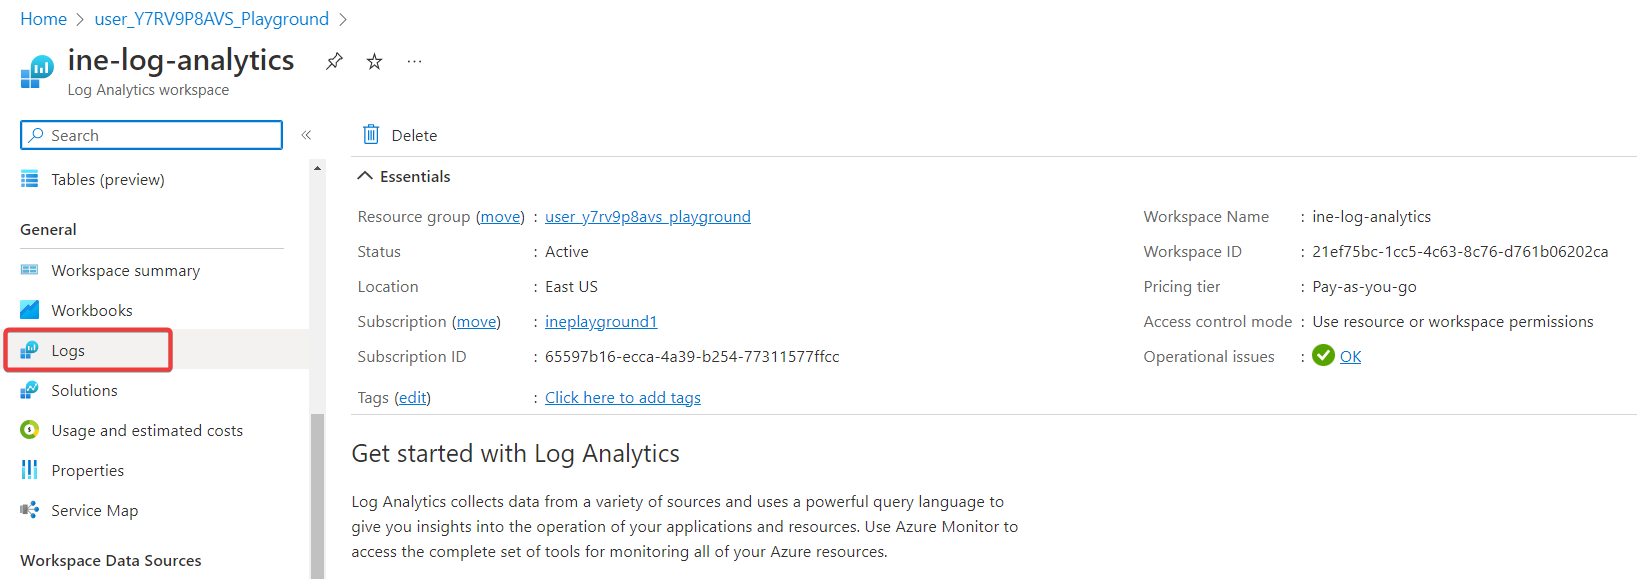
This page will provide a detailed view of the Log Analytics workspace. Click on Virtual machines from the left navigation menu.
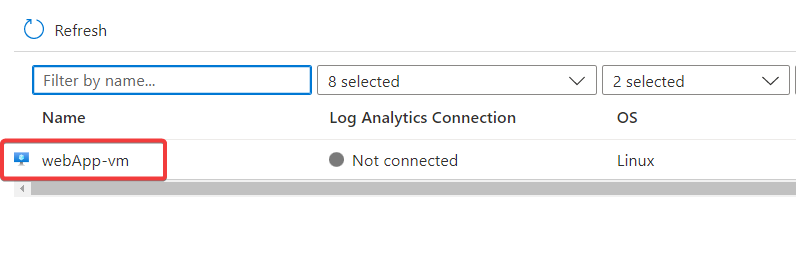
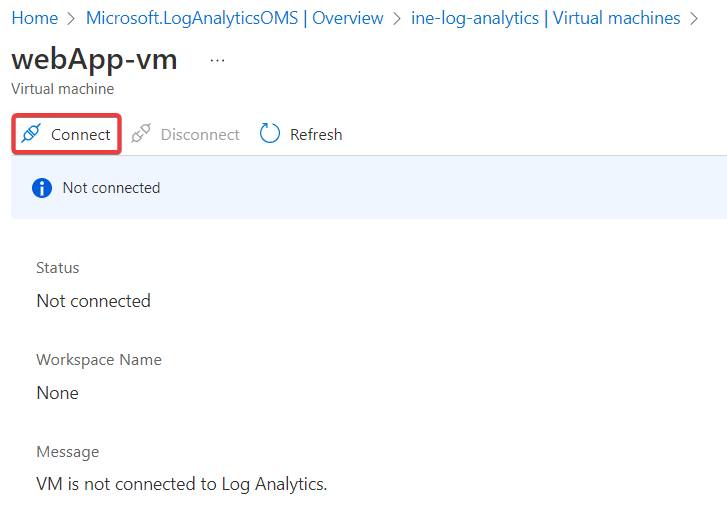
Click on webApp-vm.
Click on Connect.
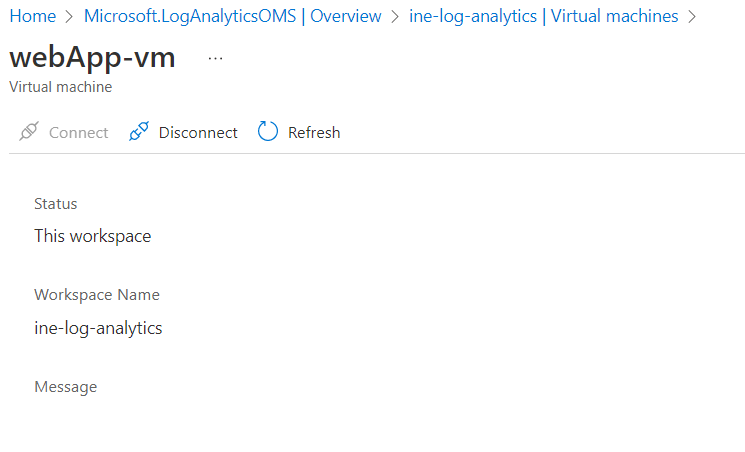
Successfully established connection between virtual machine and log analytics workspace.
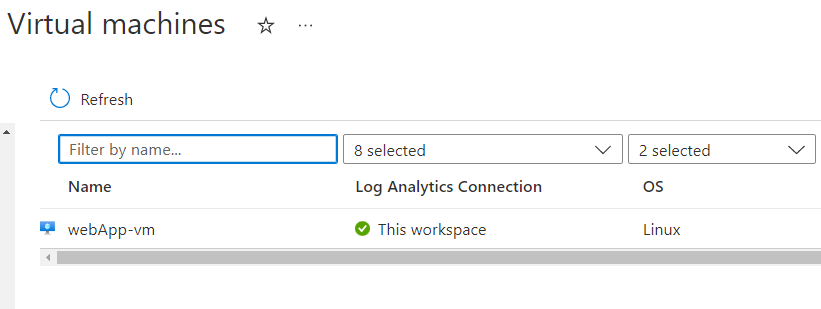
Navigate back and notice the Log analytics connection. It is connected to this workspace.
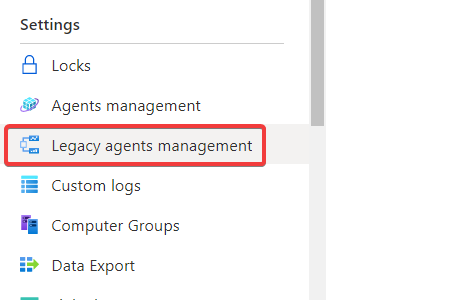
Now click on Legacy agents management.
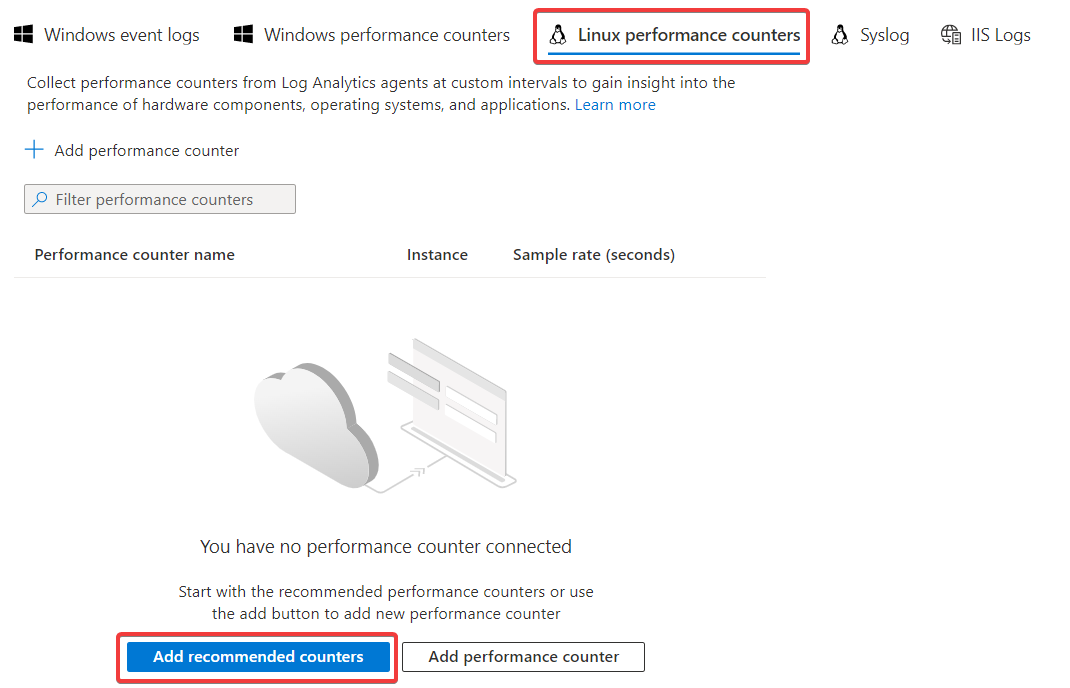
Select Linux performance counters from the top menu and click on Add recommended counters.
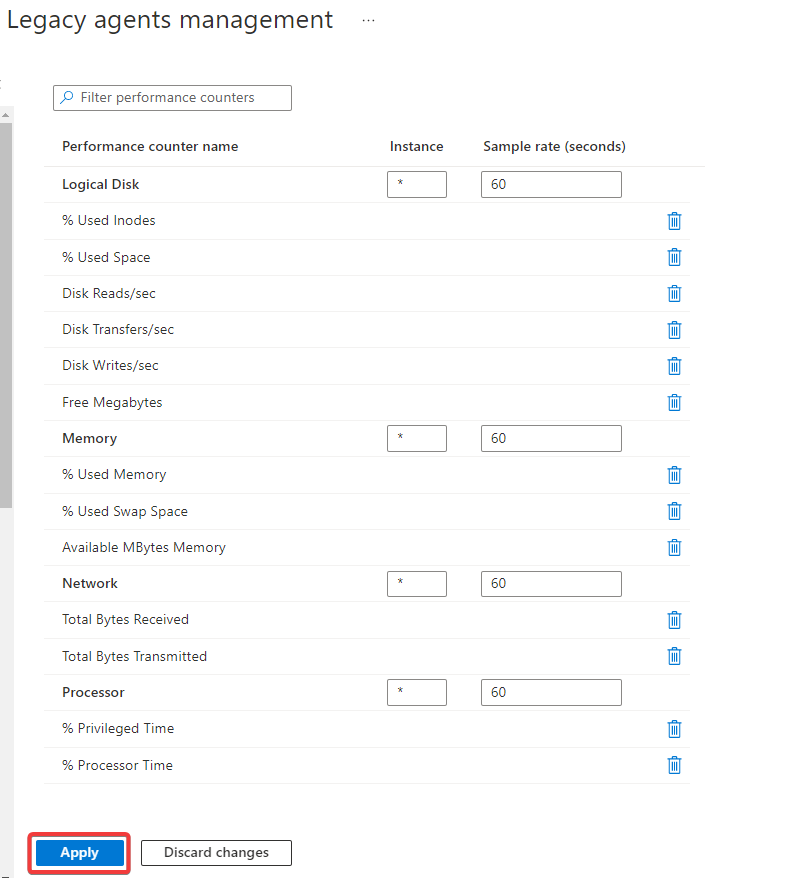
Set everything as default and click on Apply.
Connect with the virtual machine and verify if the agent is configured correctly. To connect with the Virtual machine, you need to find the password from the deployments.
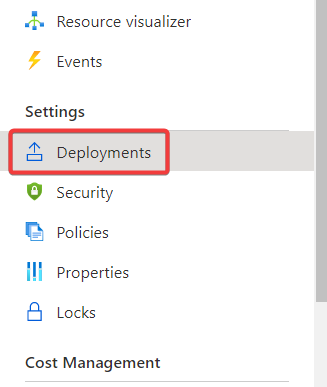
Click on Deployments.
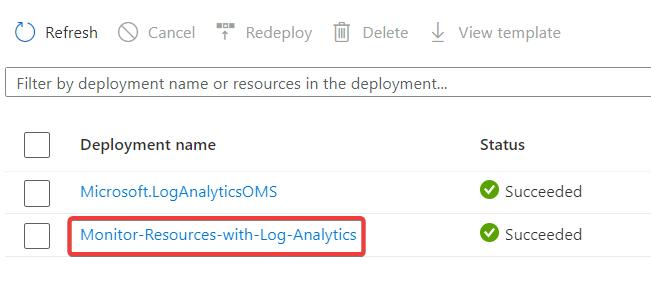
Click on Monitor-Resources-with-Log-Analytics.
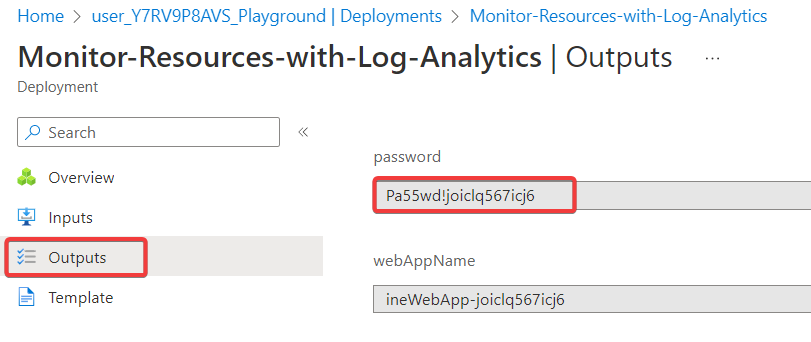
Click on Outputs and copy the password.
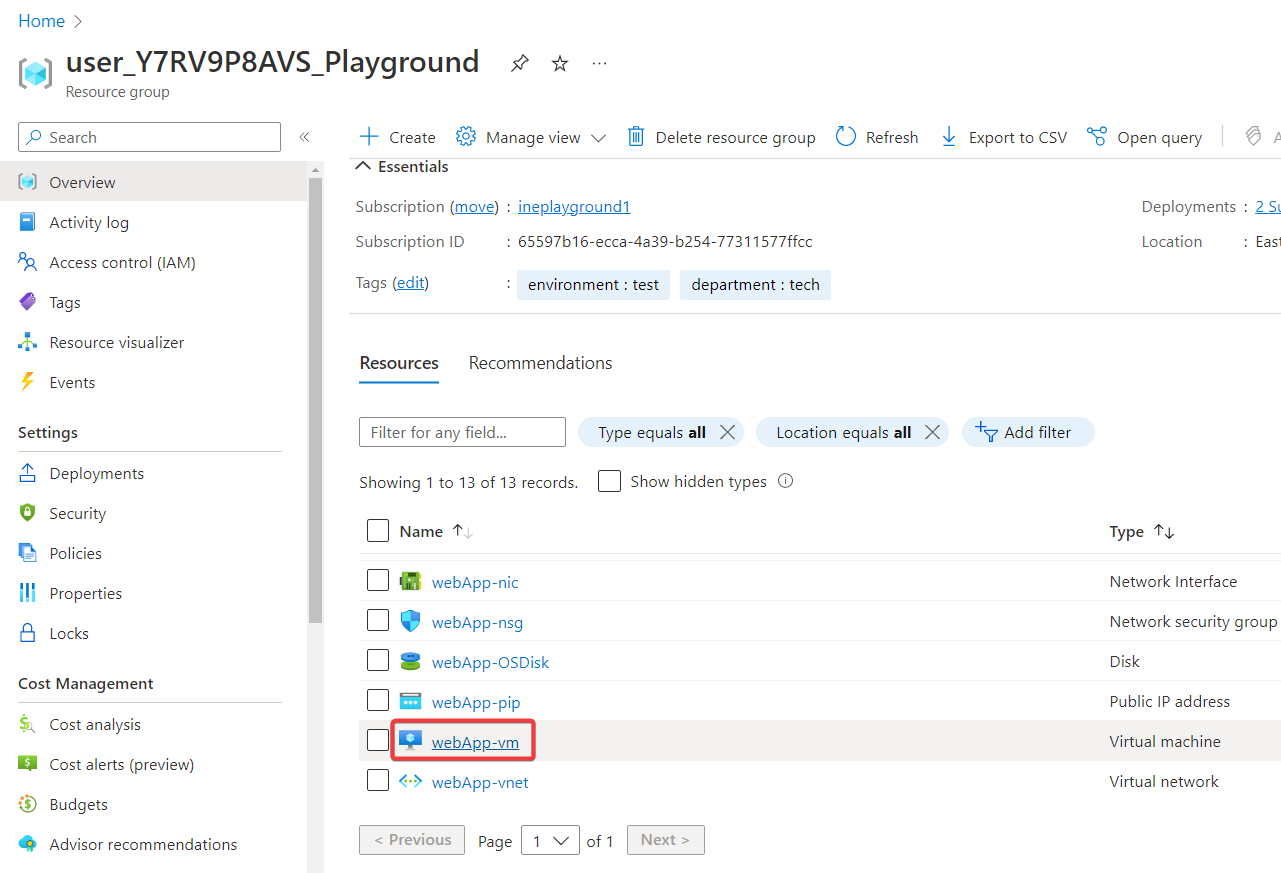
Navigate back to the resource group and click on webApp-vm.
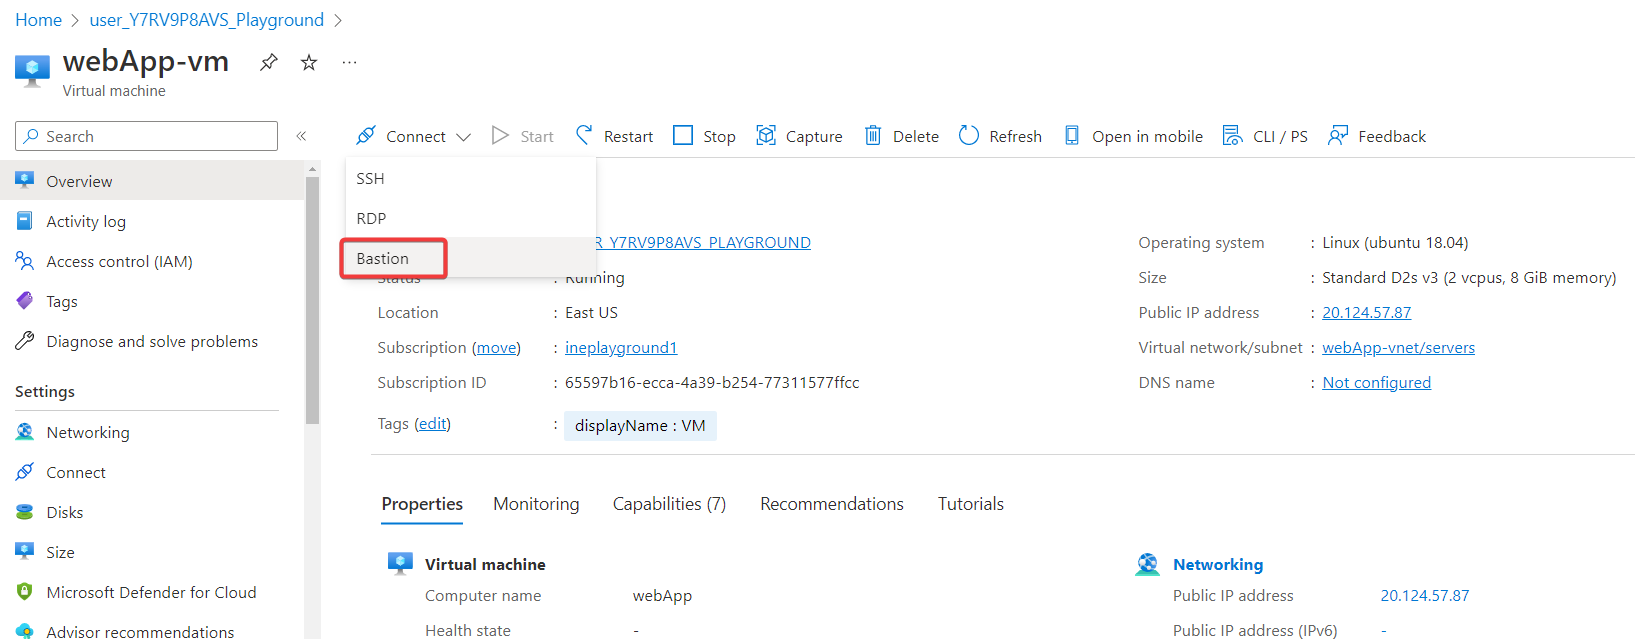
Click on Connect and choose Bastion.
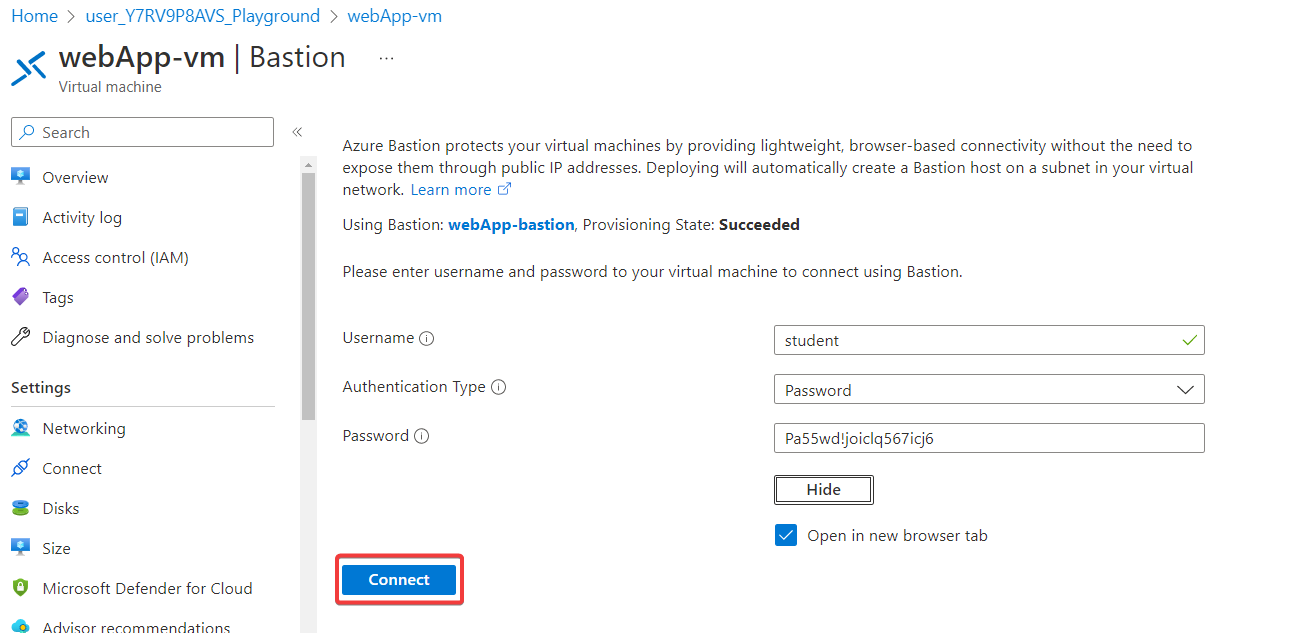
Enter the username as student and paste the copied password. Now click on Connect.
Note: Allow all the popups from this page on the browser.
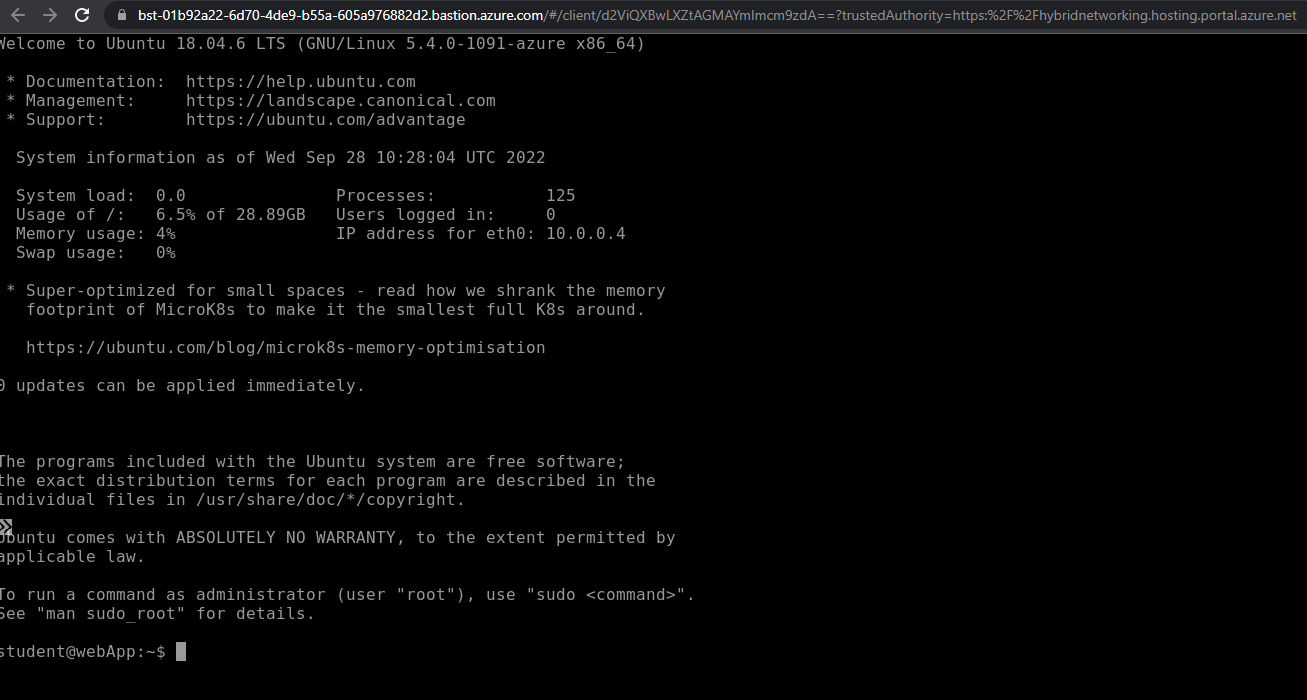
Successfully connected to the virtual machine via bastion.
Retrieve the active oms processes with the following command.
ps -aux | grep oms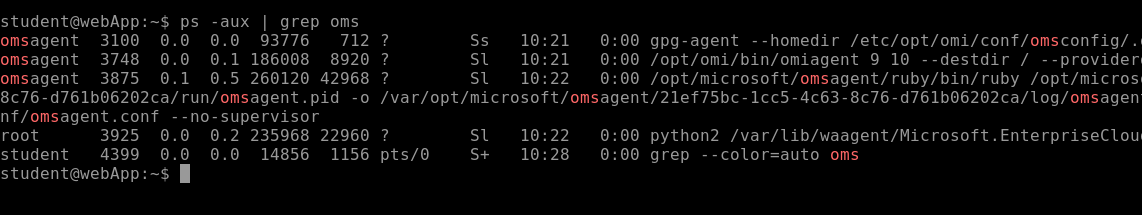
This confirms that the monitoring agent is configured properly.
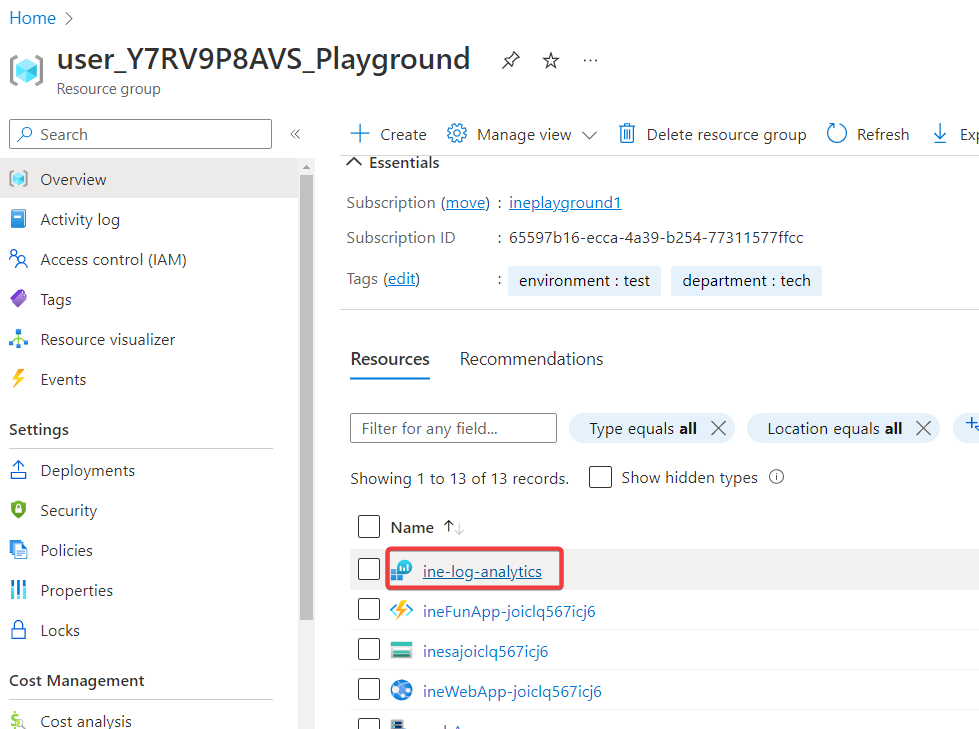
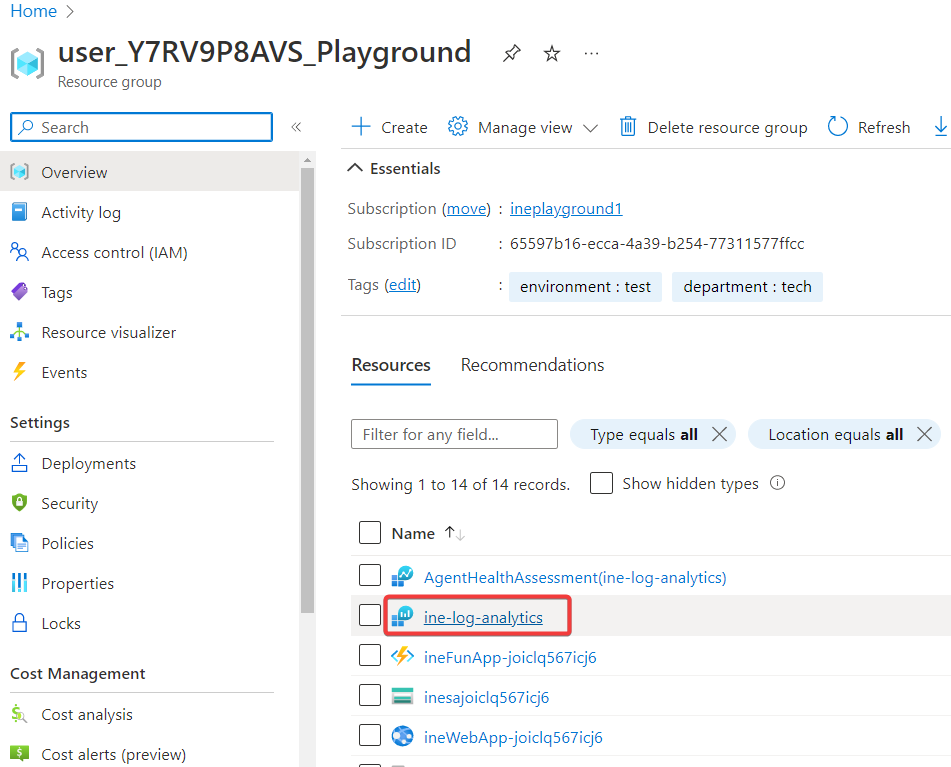
Navigate back to the resource group and click on the log analytics workspace.
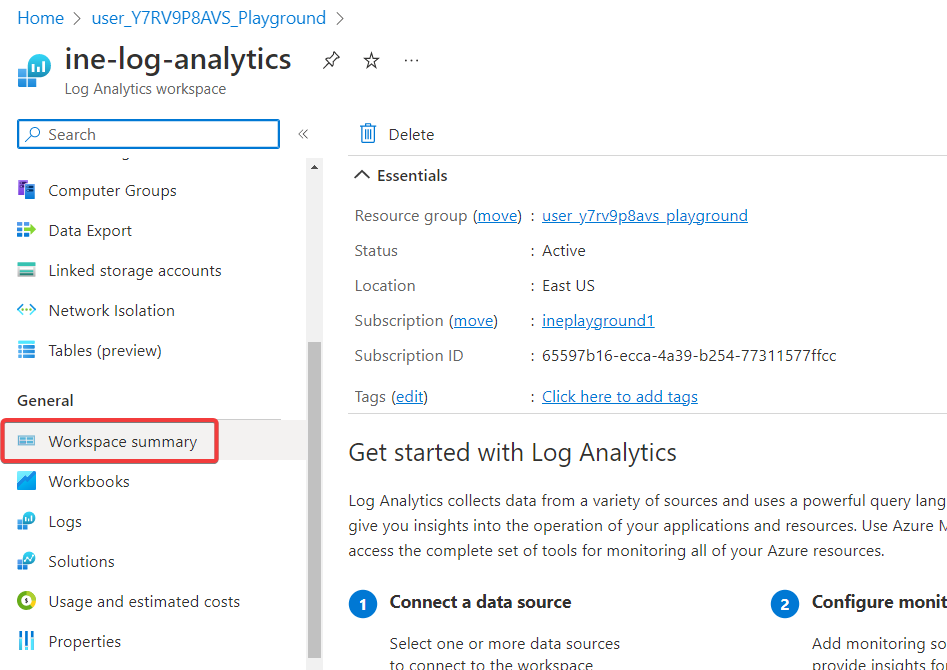
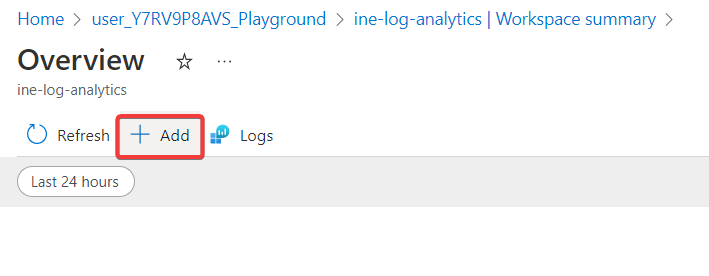
Click on Workspace summary from the left navigation menu.
Click on Add.
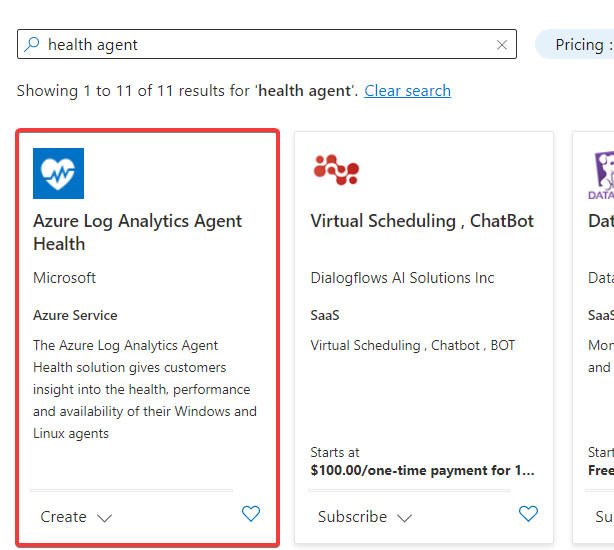
Search for a health agent and click on Azure Log Analytics Agent Health.
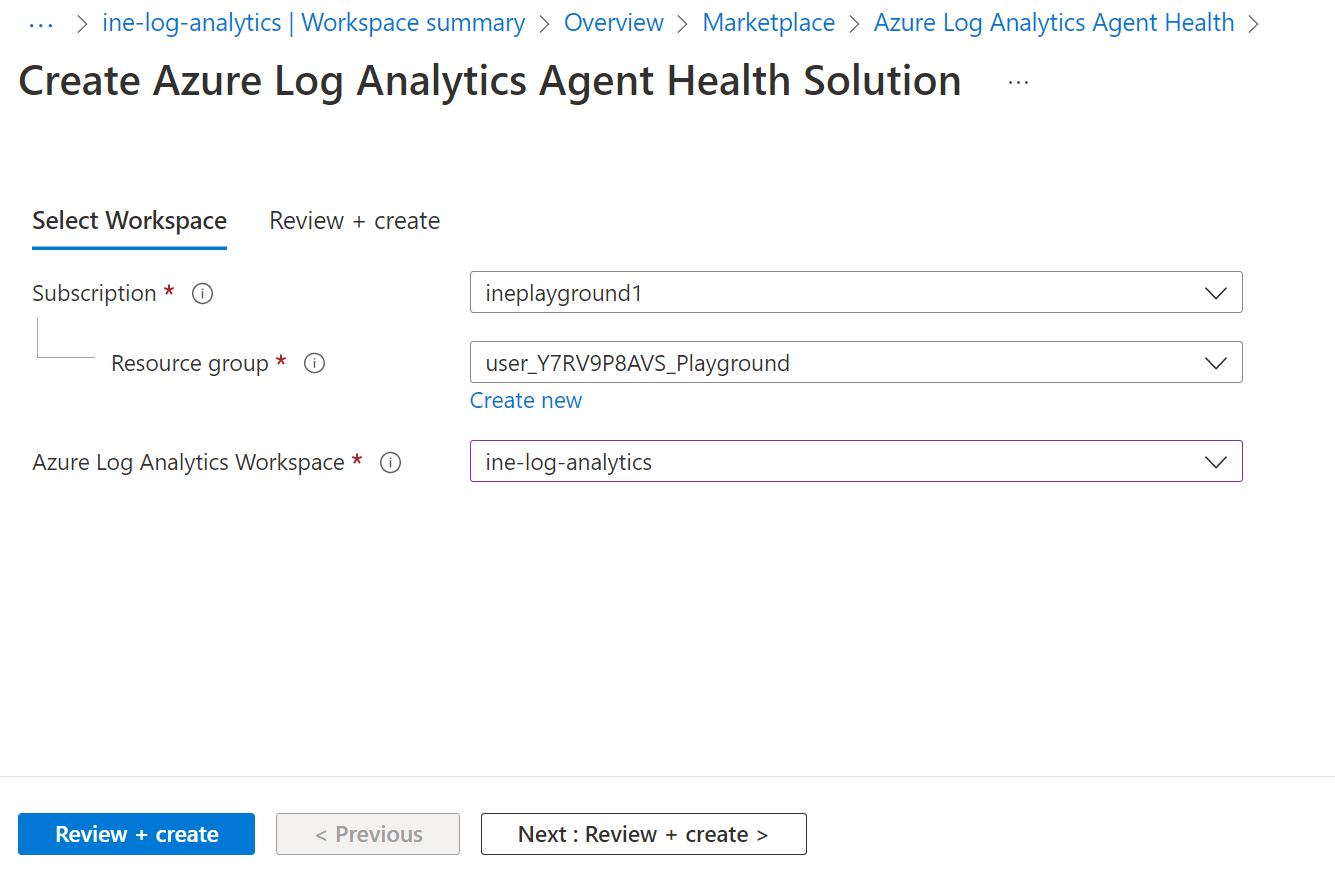
Choose the created log analytics workspace for the configuration and click on Review + create.
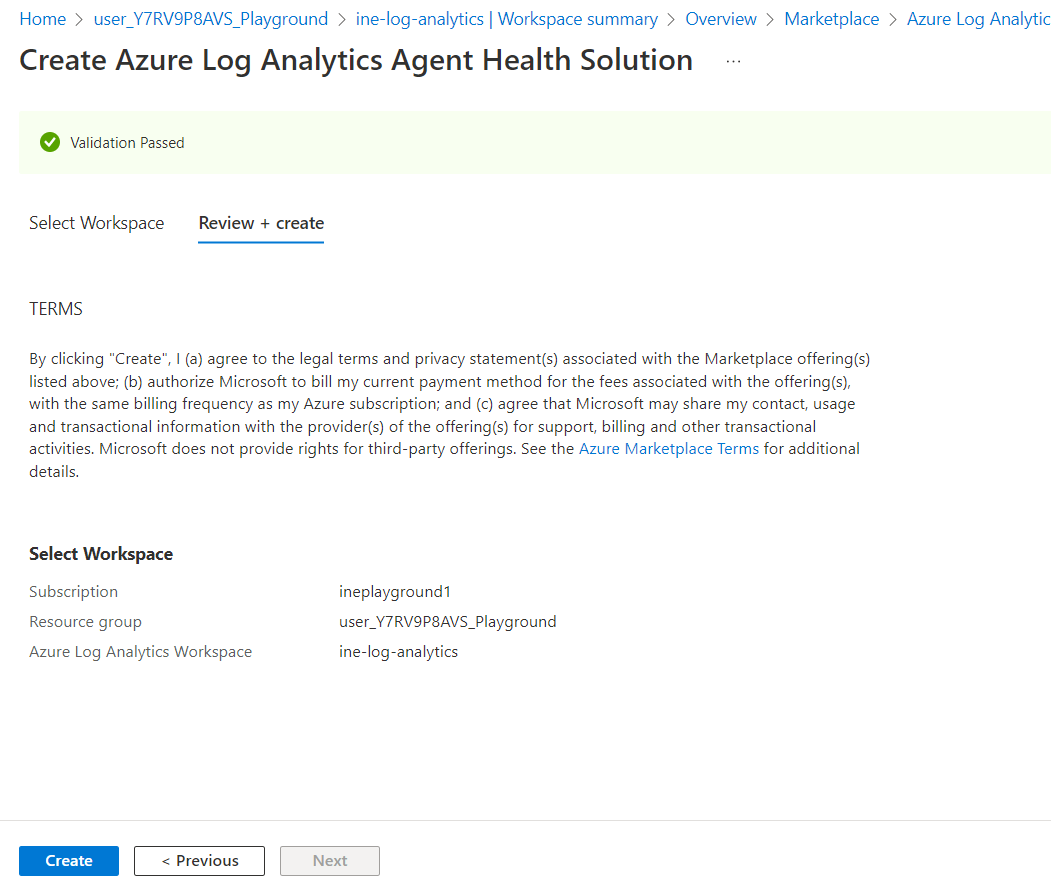
Review the configuration and click on Create.
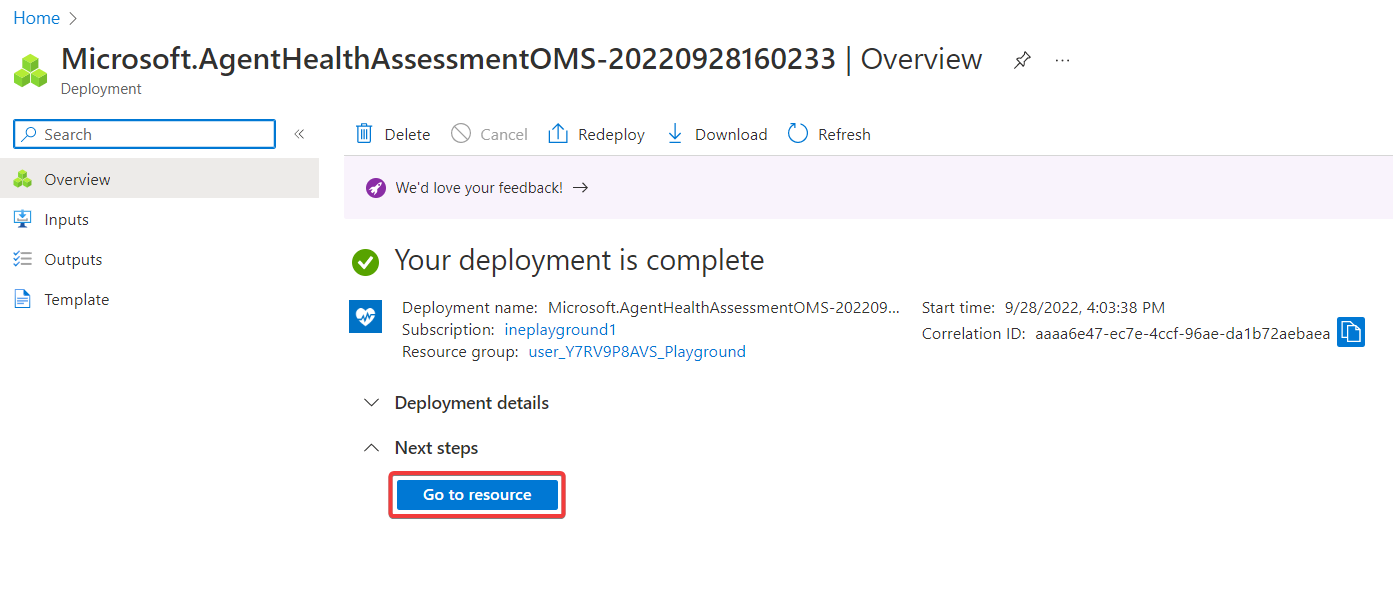
Successfully deployed Azure Log Analytics Agent Health. Now click on Go to resource.
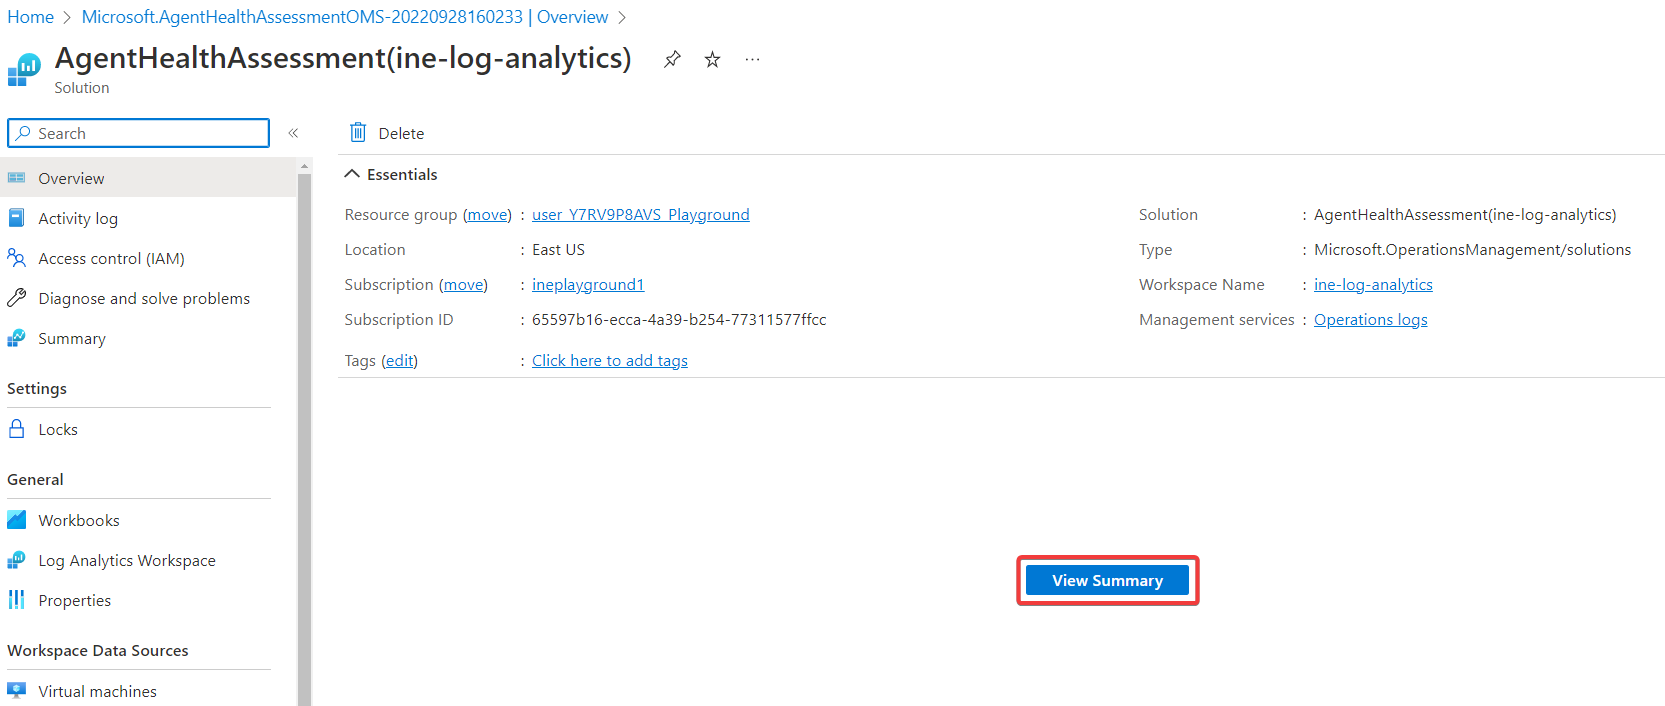
Click on View Summary.
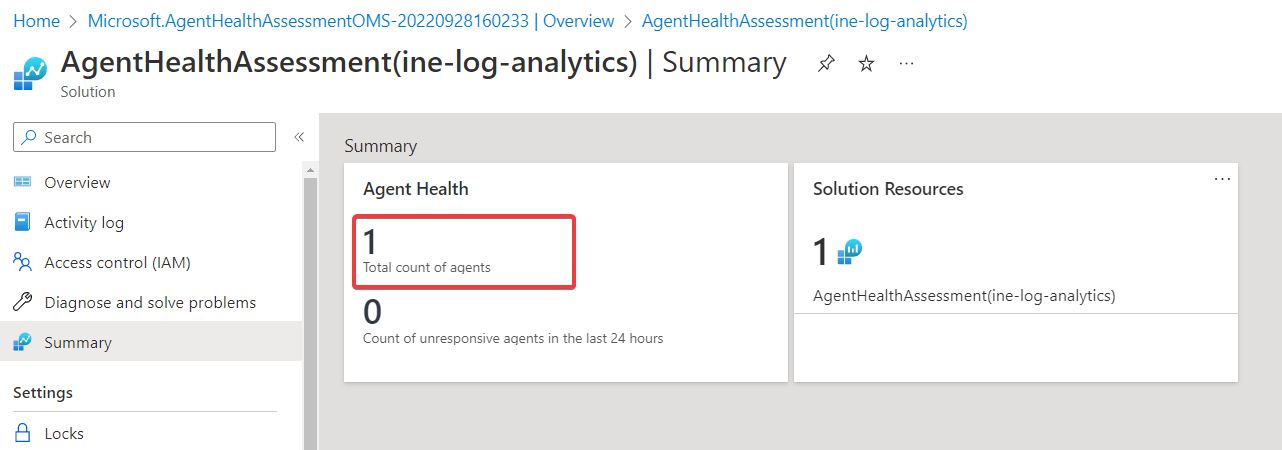
Click on the agent count to get the detailed summary.
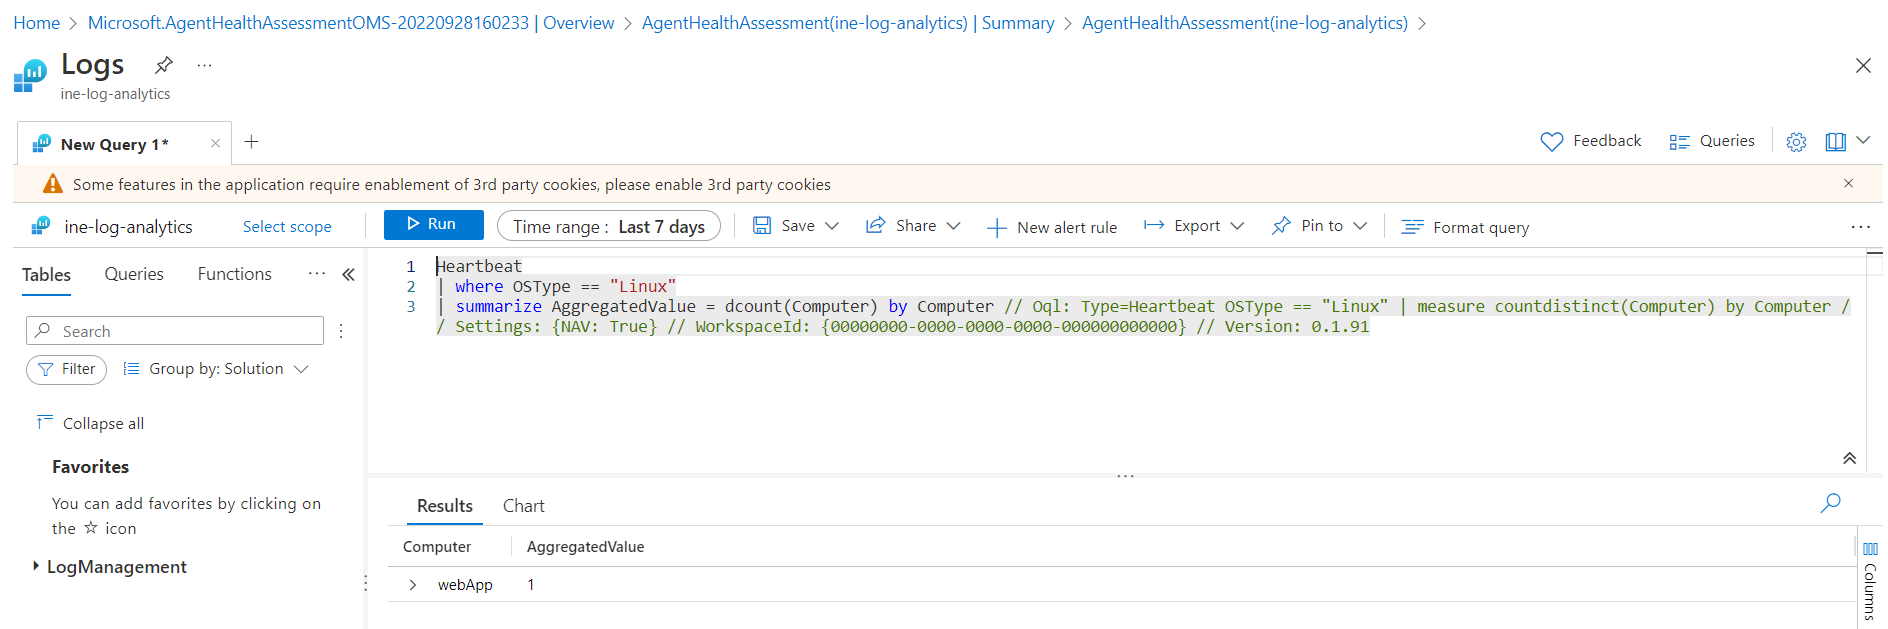
This page provides a detailed summary of the connected virtual machines. Click on Linux.
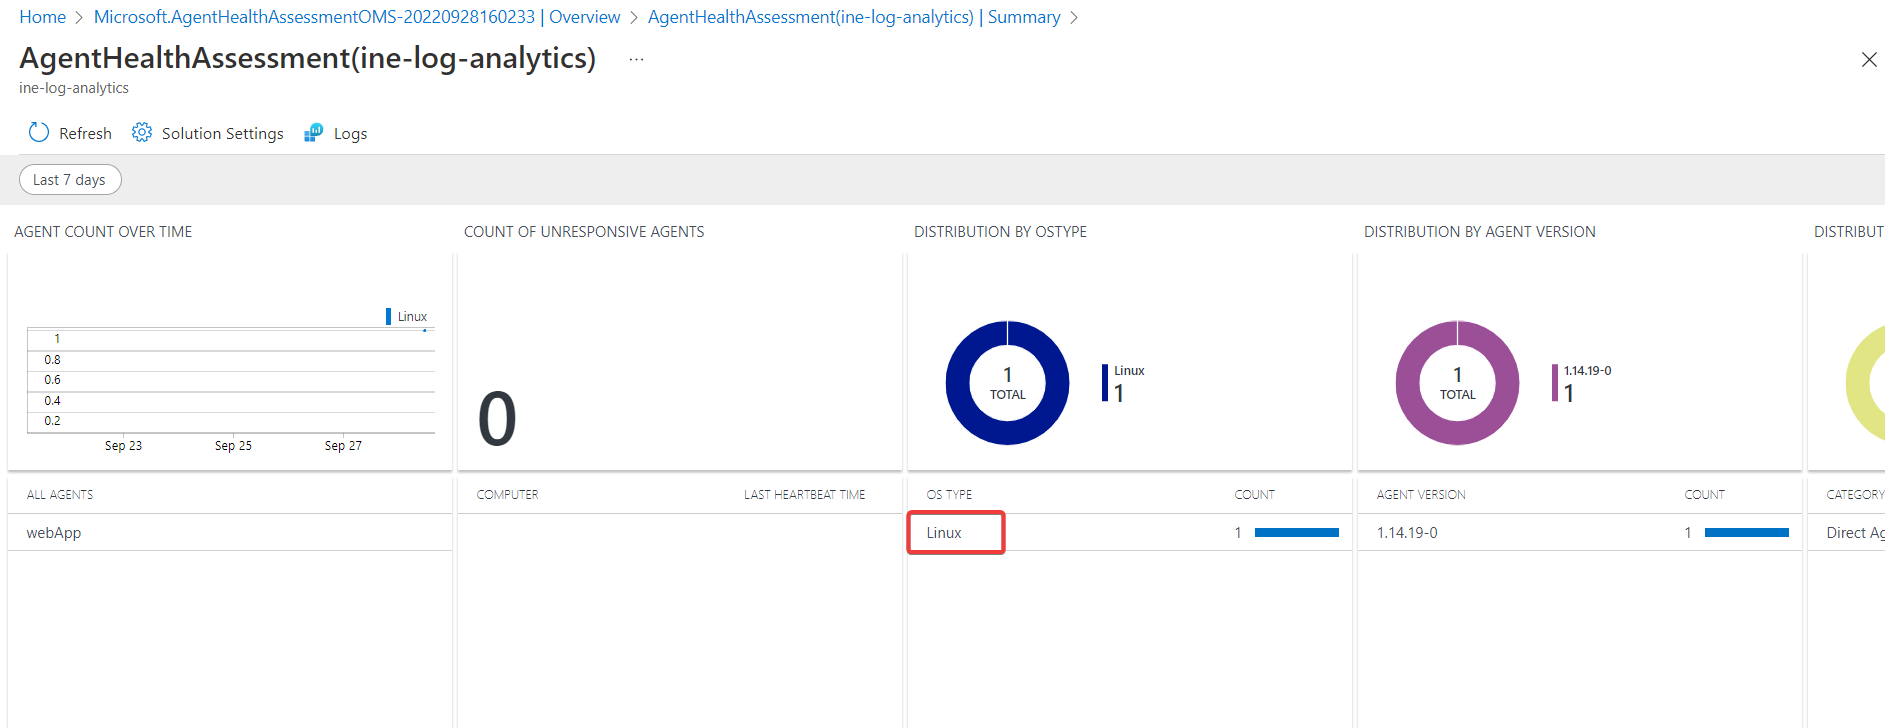
It will automatically run a query to get the computers and aggregated value.
Navigate back to resources and click on Log analytics workspace again.
Click on Logs from the left navigation menu.
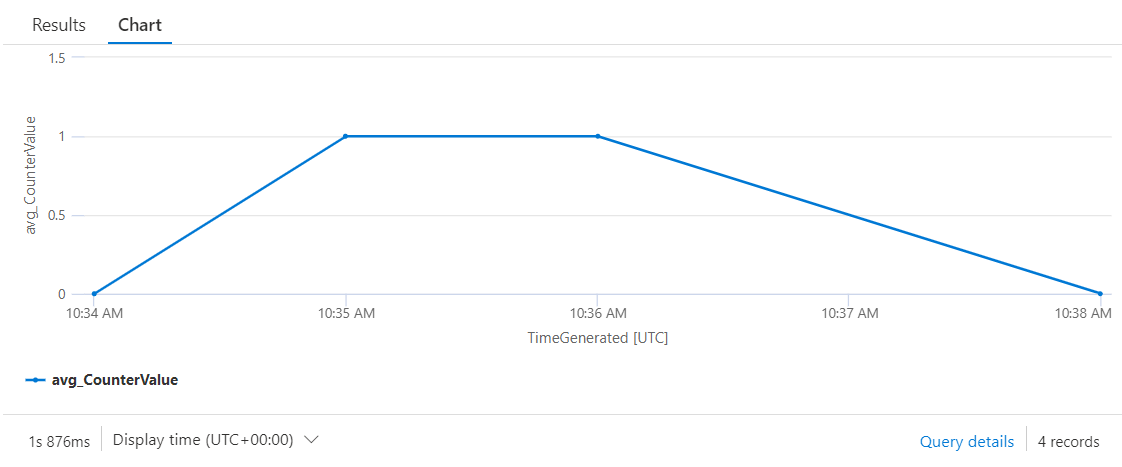
Construct a log analytics query to verify that the virtual machine is reporting metrics to the log analytics workspace.
Copy and paste the log analytics query. Select the whole query and click on Run.
Perf
| where Computer == 'webApp'
| where CounterName  == "% Processor Time"
| where InstanceName == "_Total"
| summarize avg(CounterValue) by bin(TimeGenerated, 15s)
| render  timechart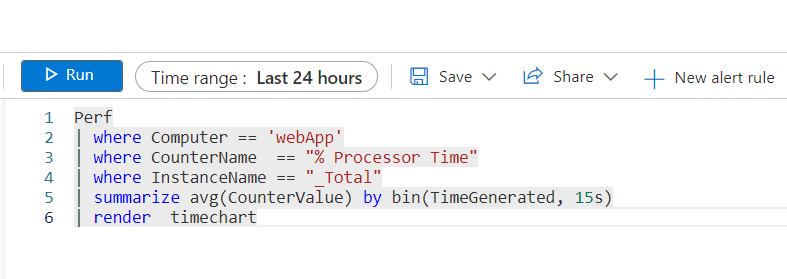
By default, it will display the result in the chart which is mentioned in the query.
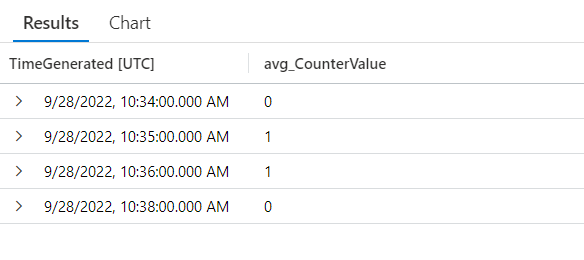
Click on Results to view query results in a table organized by columns and rows.
Our lab is now completed.