Construct log analytics query in log analytics workspace running in an emulated Azure environment.
Analyze virtual machine performance
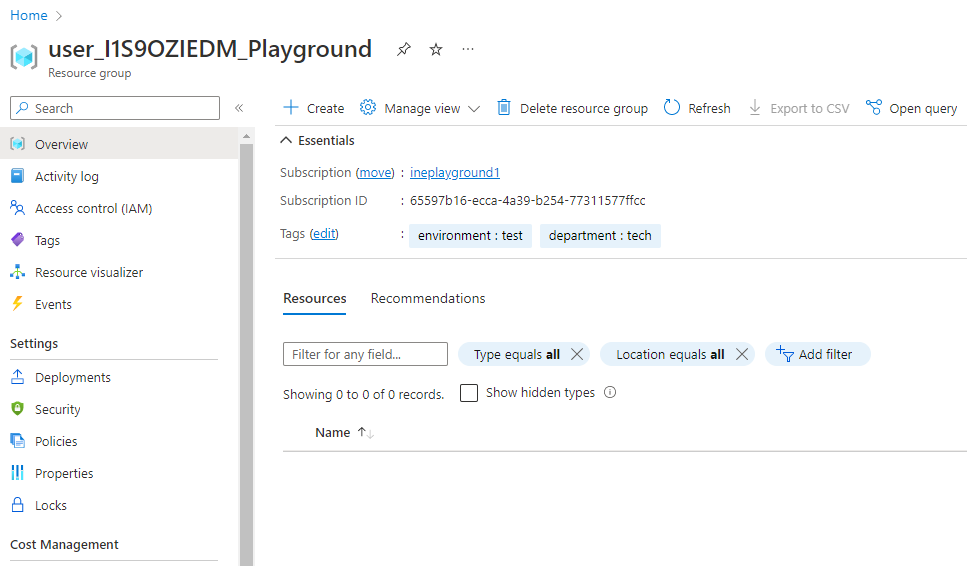
When you log in to Azure with the provided credentials, you will find an empty resource group.
This lab uses the Log Analytics demo environment, which includes plenty of sample data that supports the sample queries.
Navigate to the Log Analytics demo environment using the following URL.
https://portal.azure.com/#view/Microsoft_Azure_Monitoring_Logs/DemoLogsBlade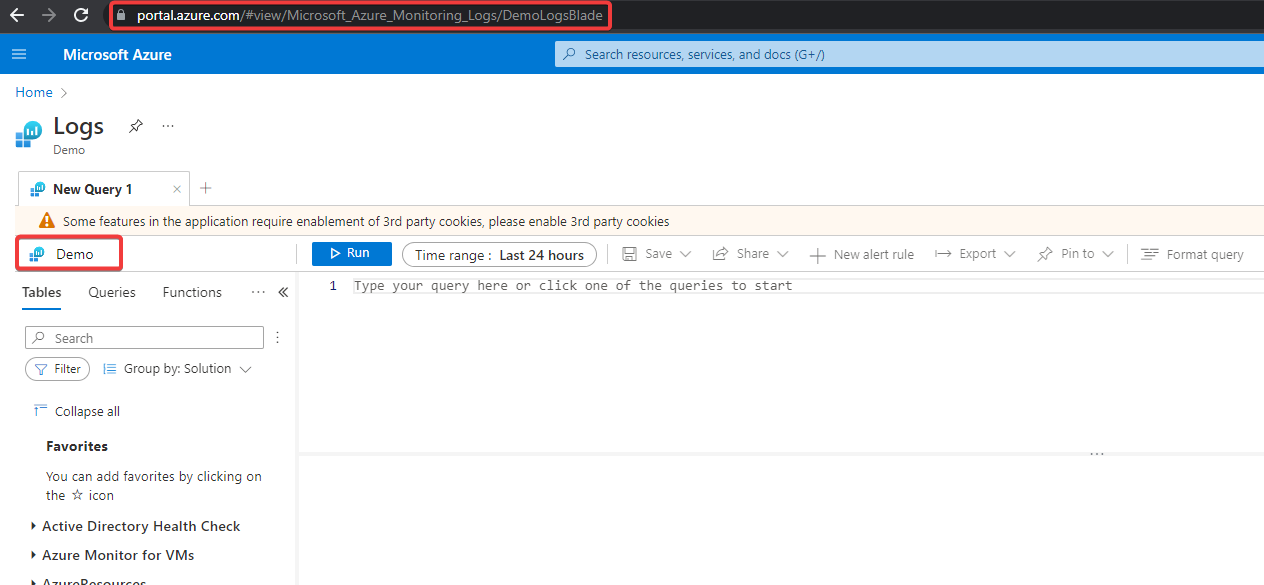
Construct a log analytics query that returns the following information:
Copy and paste the log analytics query and click on Run by selecting the whole query.
Perf
| where TimeGenerated > ago(1h)
| where (CounterName == "% Processor Time" and InstanceName == "_Total")
| project TimeGenerated, Computer, CounterValue
| summarize avg(CounterValue) by Computer, bin(TimeGenerated, 1m)
| where avg_CounterValue > 100
| render timechart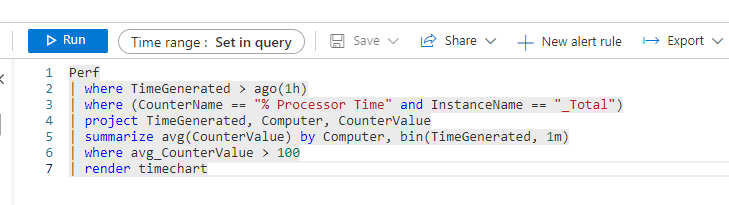
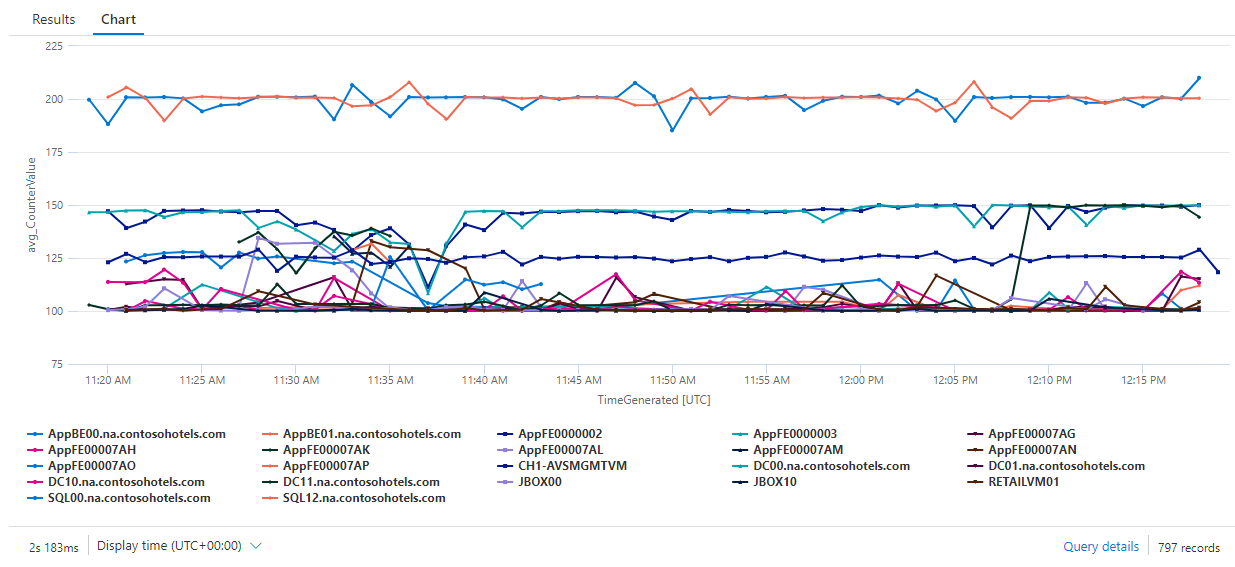
To view the results in a graph, select Chart on the results pane. Notice that there are various options for working with the chart, such as changing it to another type.
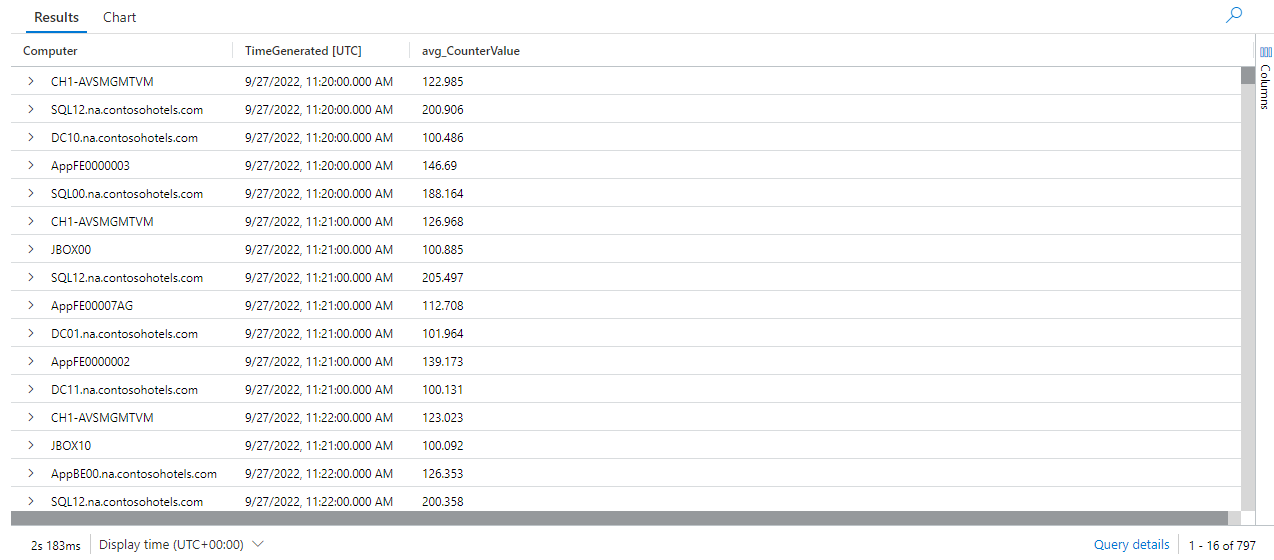
Click on Results to view query results in a table organized by columns and rows.
Construct a log analytics query that returns the following information:
Copy and paste the log analytics query and click on Run by selecting the whole query.
search in (Event, SecurityEvent) "Antimalware"
| summarize count(Computer) by Computer
| top 10 by count_Computer desc nulls last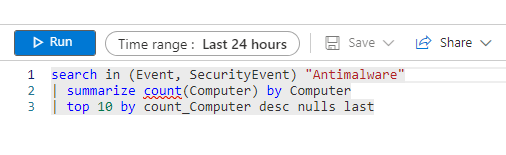
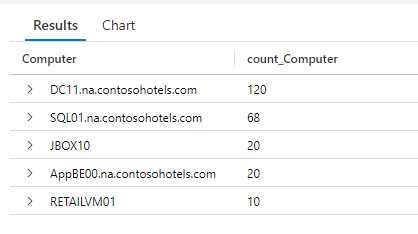
The result will provide the details about the computer and the count of computers.
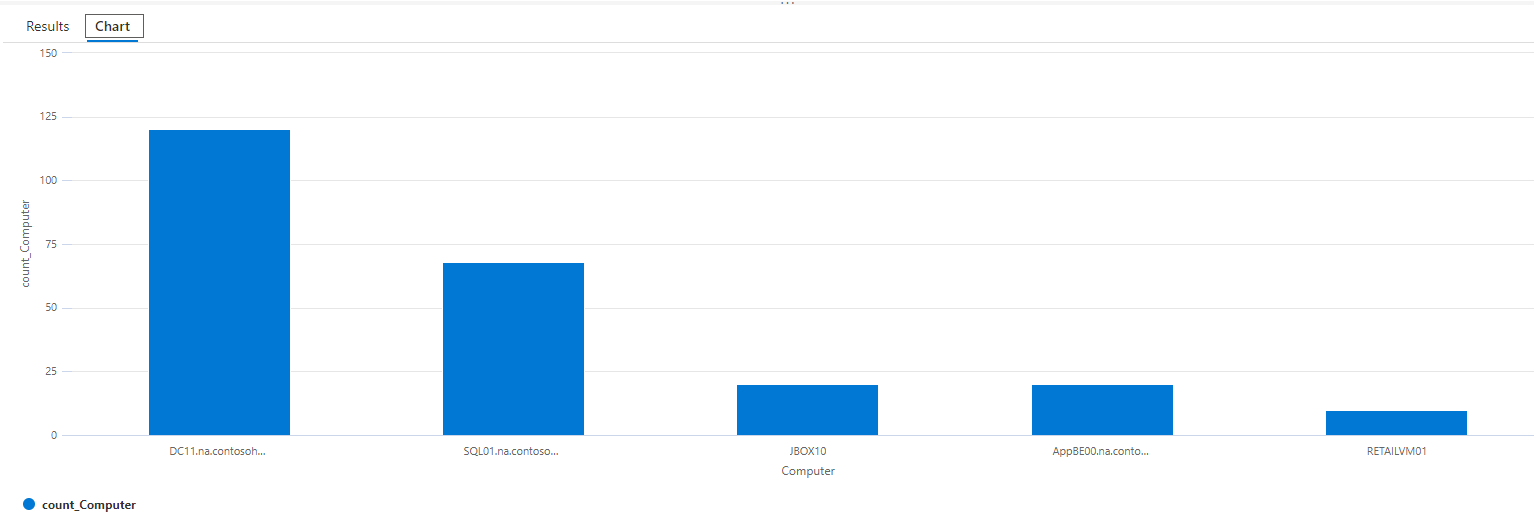
Click on Chart to display the results as a chart.
Our lab is now completed.