Alerting on Saturation-related Issues
In this lesson, we will discuss the issues related to the Saturation Key Metric.
Measure saturation#
Saturation measures the fullness of our services and the system. We should be aware if replicas of our services are processing too many requests and being forced to queue some of them. We should also monitor whether usage of our CPUs, memory, disks and other resources reaches critical limits.
Measure CPU usage#
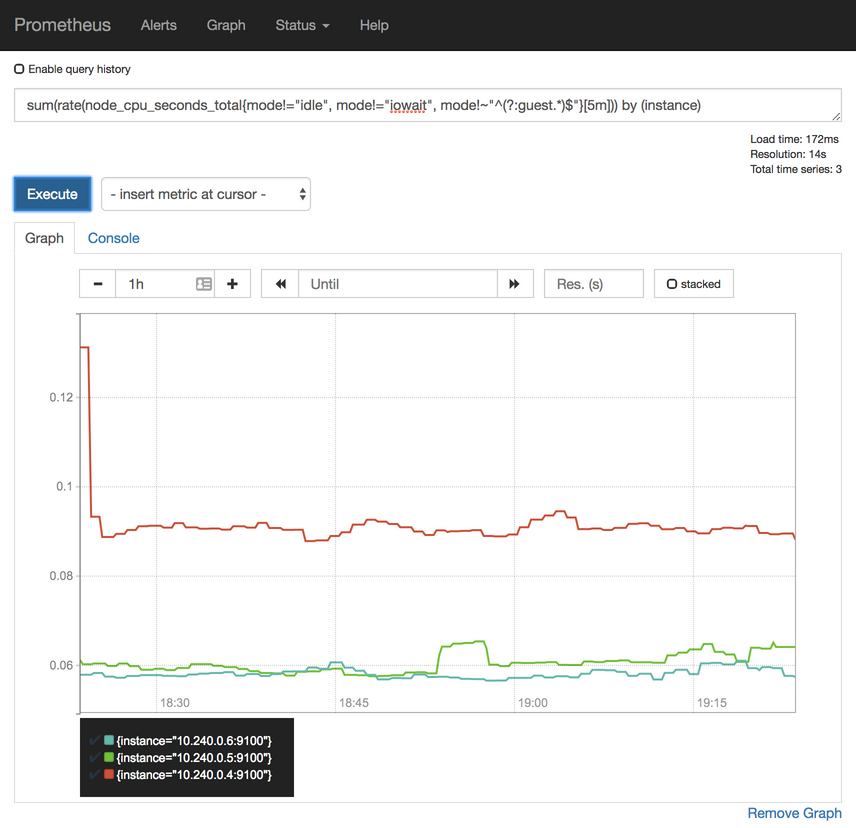
For now, we’ll focus on CPU usage. We’ll start by opening the Prometheus's graph screen.
open "http://$PROM_ADDR/graph"
Let’s see if we can get the rate of used CPU by node (instance). We can use node_cpu_seconds_total metric for that. However, it is split into different modes, and we’ll have to exclude a few of them to get the “real” CPU usage. Those will be idle, iowait, and any type of guest cycles.
Please type the expression that follows, and press the Execute button.
sum(rate(
  node_cpu_seconds_total{
    mode!="idle",
    mode!="iowait",
    mode!~"^(?:guest.*)$"
  }[5m]
))
by (instance)
Switch to the Graph view.
The output represents the actual usage of CPU in the system. In my case (screenshot below), excluding a temporary spike, all nodes are using less than a hundred CPU milliseconds. The system is far from being under stress.
Percentage of used CPU#
As you already noticed, absolute numbers are rarely useful. We should try to discover the percentage of used CPU. We’ll need to find out how much CPU our nodes have. We can do that by counting the number of metrics. Each CPU gets its own data entry, one for each mode. If we limit the result to a single mode (e.g., system), we should be able to get the total number of CPUs.
Please type the expression that follows, and press the Execute button.
count(
  node_cpu_seconds_total{
    mode="system"
  }
)
In my case (screenshot below), there are six cores in total. Yours is likely to be six as well if you’re using GKE, EKS, or AKS from the Gists. If, on the other hand, you’re running the cluster in Docker For Desktop or minikube, the result should be one node.
Now we can combine the two queries to get the percentage of used CPU
Please type the expression that follows, and press the Execute button.
sum(rate(
  node_cpu_seconds_total{
    mode!="idle",
    mode!="iowait",
    mode!~"^(?:guest.*)$"
  }[5m]
)) /
count(
  node_cpu_seconds_total{
    mode="system"
  }
)
We summarized the rate of used CPUs and divided it by the total number of CPUs. In my case (screenshot below), only three to four percent of CPU is currently used. That is not a surprise since most of the system is at rest. Not much is going on in our cluster right now.

Now that we know how to fetch the percentage of used CPU of the whole cluster, we’ll move our attention to applications.
Measure allocatable CPUs#
We’ll try to discover how many allocatable cores we have. From the application’s perspective, allocatable CPU’s show how much can be requested for Pods, at least when they’re running in Kubernetes. Allocatable CPU is always lower than the total CPU.
Please type the expression that follows, and press the Execute button.
kube_node_status_allocatable_cpu_cores
The output should be lower than the number of cores used by our VMs. The allocatable cores show the amount of CPU that can be assigned containers. To be more precise, allocatable cores are the number of CPUs assigned to nodes minus those reserved by system-level processes. In my case (screenshot below), there are almost two full allocatable CPUs.

However, in this context, we are interested in the total amount of allocatable CPUs since we are trying to discover how much is used by our Pods inside the whole cluster. So, we’ll sum the allocatable cores.
Please type the expression that follows, and press the Execute button.
sum(
  kube_node_status_allocatable_cpu_cores
)
In my case, the total allocatable CPUs are somewhere around 5.8 cores. For the exact number, please hover on the graph line.
Now that we know how many allocatable CPUs we have, we should try to discover how much was requested by Pods.
Please note that the requested resources are not the same as the used resources. We’ll get to that use-case later. For now, we want to know how much we requested from the system.
Measure requested CPUs#
Please type the expression that follows, and press the Execute button.
kube_pod_container_resource_requests_cpu_cores
We can see that the requested CPU is relatively low. In my case, all the containers with the requested CPU have their values below 0.15 (hundred and fifty milliseconds). Your result might differ.
Just as with allocatable CPU, we are interested in the sum of the requested CPU. Later on, we’ll be able to combine the two results and deduce how much is left unreserved in the cluster.
Please type the expression that follows, and press the Execute button.
sum(
  kube_pod_container_resource_requests_cpu_cores
)
We summed all the CPU resource requests. As a result, in my case (screenshot below), all the requested CPUs are slightly below 1.5.

Now, let’s combine the two expressions and see the percentage of requested CPU.
Please type the expression that follows, and press the Execute button.
sum(
  kube_pod_container_resource_requests_cpu_cores
) /
sum(
  kube_node_status_allocatable_cpu_cores
)
In my case, the output shows that around a quarter (0.25) of all allocatable CPU is reserved. That means that we could have four times as many CPU requests before we reach the need to expand the cluster. Of course, you already know that, if present, Cluster Autoscaler will add nodes before that happens. Still, knowing that we are close to reaching CPU limits is important. Cluster Autoscaler might not be working correctly, or it might not even be active. The latter case is true for most, if not all on-prem clusters.
Convert the expressions into alerts#
Let’s see whether we can convert the expressions we explored into alerts.
We’ll explore yet another difference between a new set of Chart values and those we used before.
diff mon/prom-values-latency2.yml \
    mon/prom-values-cpu.yml
The output is as follows.
64c64
<   expr: sum(rate(nginx_ingress_controller_requests[5m])) by (ingress) / sum(label_join(kube_deployment_status_replicas, "ingress", ",", "deployment")) by (ingress) > 0.1
---
>   expr: sum(rate(nginx_ingress_controller_requests[5m])) by (ingress) / sum(label_join(kube_deployment_status_replicas, "ingress", ",", "deployment")) by (ingress) > 1
87a88,103
> - alert: NotEnoughCPU
>   expr: sum(rate(node_cpu_seconds_total{mode!="idle", mode!="iowait", mode!~"^(?:guest.*)$"}[5m])) / count(node_cpu_seconds_total{mode="system"}) > 0.9
>   for: 30m
>   labels:
>     severity: notify
>   annotations:
>     summary: There's not enough CPU
>     description: CPU usage of the cluster is above 90%
> - alert: TooMuchCPURequested
>   expr: sum(kube_pod_container_resource_requests_cpu_cores) / sum(kube_node_status_allocatable_cpu_cores) > 0.9
>   for: 30m
>   labels:
>     severity: notify
>   annotations:
>     summary: There's not enough allocatable CPU
>     description: More than 90% of allocatable CPU is requested
We can see from the differences that we restored the original threshold of TooManyRequests back to 1 and that we added two new alerts called NotEnoughCPU and TooMuchCPURequested.
The NotEnoughCPU alert will fire if more than ninety percent of CPU across the whole cluster is used for over thirty minutes. That way we’ll avoid setting alarms if there is a temporary spike in CPU usage.
The TooMuchCPURequested also has the threshold of ninety percent and will be triggered if it persists for over thirty minutes. The expression computes the total amount of requested CPU divided by the total amount of allocatable CPU.
Both alerts are reflections of the Prometheus expressions we executed a short while ago, so you should already be familiar with their purpose.
Let’s upgrade the Prometheus Chart with the new values and open the alerts screen.
helm upgrade prometheus \
  stable/prometheus \
  --namespace metrics \
  --version 9.5.2 \
  --set server.ingress.hosts={$PROM_ADDR} \
  --set alertmanager.ingress.hosts={$AM_ADDR} \
  -f mon/prom-values-cpu.yml

open "http://$PROM_ADDR/alerts"
All that’s left is to wait until the two new alerts appear. If they are not already there, please refresh your screen.
There’s probably no need to see the new alerts in action. By now, you should trust the flow, and there’s no reason to believe that they would not trigger.

Allocatable CPU is always higher than the total CPU.
A)
True
B)
False
In a “real world” scenario, receiving one of the two alerts might provoke different reactions depending on the Kubernetes flavor we’re using.
Automate the current infrastructure#
If we do have Cluster Autoscaler (CA), we might not need NotEnoughCPU and TooMuchCPURequested alerts. The fact that ninety percent of node CPUs are in use does not prevent the cluster from operating correctly, just as long as our CPU requests are set correctly. Similarly, having ninety percent of allocatable CPU reserved is also not an issue. If Kubernetes cannot schedule a new Pod due to all CPU being reserved, it will scale up the cluster. As a matter of fact, reaching almost full CPU usage or having nearly all allocatable CPU reserved is a good thing. That means that we are having as much CPU as we need and that we are not paying for unused resources. Still, that logic works mostly with Cloud providers and not even all of them.
All that does not mean that we should rely only on Cluster Autoscaler. It can malfunction, like anything else. However, since CA is based on watching for unschedulable Pods, if it does fail to work, we should detect that through observing Pod statuses, not CPU usage. Still, it might not be a bad idea to receive alerts when CPU usage is too high, but in that case, we might want to increase the threshold to a value closer to a hundred percent.
If our cluster is on-prem or, to be more precise, if it does not have Cluster Autoscaler, the alerts we explored are essential if our process for scaling up the cluster is not automated or if it’s slow. The logic is simple. If we need more than a couple of minutes to add new nodes to the cluster, we cannot wait until Pods are unschedulable. That would be too late. Instead, we need to know that we are out of available capacity before the cluster becomes full (saturated) so that we have enough time to react by adding new nodes to the cluster.
Still, having a cluster that does not auto-scale because Cluster Autoscaler does not work is not an excuse good enough. There are plenty of other tools that we can use to automate our infrastructure. When we do manage to get to such a place that we can automatically add new nodes to the cluster, the destination of the alert should change. Instead of receiving notifications to Slack, we might want to send a request to a service that will execute the script which will result in a new node being added to the cluster. If our cluster is running on VMs, we can always add more through a script (or some tool). The only real excuse to receive those notifications to Slack is if our cluster is running on bare-metal. In such a case, we cannot expect scripts to create new servers magically. For everyone else, Slack notifications when too much CPU is used or all allocated CPU is reserved should be only a temporary solution until proper automation is in place.
Now, let’s try to accomplish similar goals but, this time, by measuring memory usage and reservations.
In the next lesson, we will see how to measure memory usage.
