Saturation-related Issues: Measure Memory Usage
In this lesson, we will continue the Saturation Related issue in the context of measuring memory usage.
Measure memory usage#
Measuring memory consumption is similar to CPU, and yet there are a few differences that we should take into account. But, before we get there, let’s go back to the Prometheus's graph screen and explore our first memory-related metric.
open "http://$PROM_ADDR/graph"
Just as with CPU, first we need to find out how much memory each of our nodes has.
Please type the expression that follows, press the Execute button, and switch to the Graph tab.
node_memory_MemTotal_bytes
Your result is likely to be different than mine. In my case, each node has around 4GB of RAM.
Knowing how much RAM each node has is of no use without knowing how much RAM is currently available. We can get that info through the node_memory_MemAvailable_bytes metric.
Please type the expression that follows, and press the Execute button.
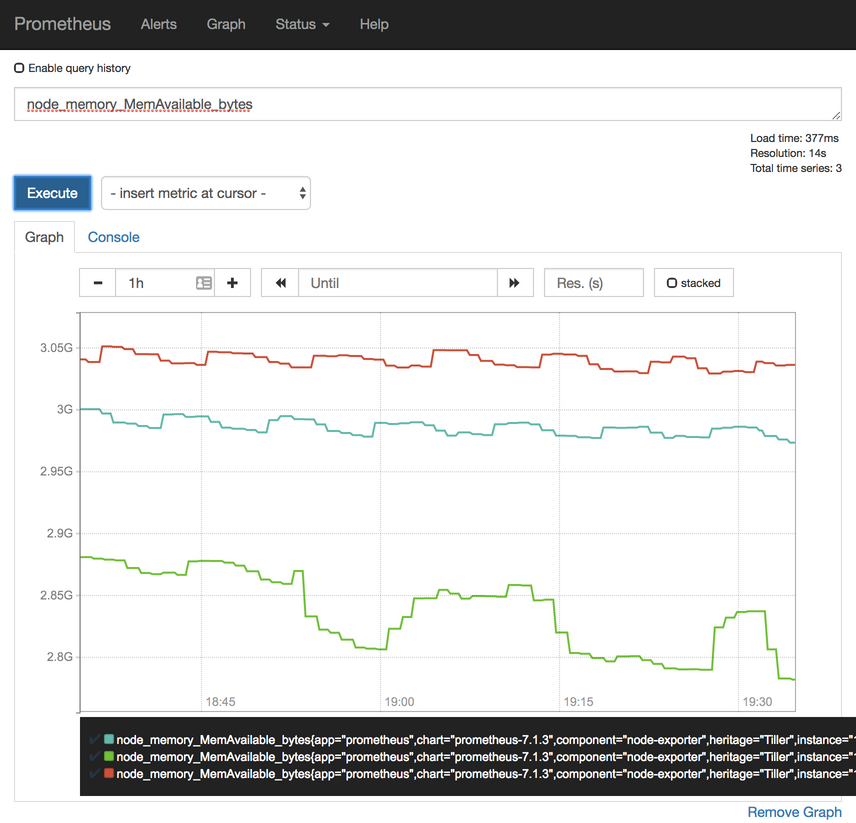
node_memory_MemAvailable_bytes
We can see the available memory on each of the nodes of the cluster. In my case (screenshot below), each has around 3GB of available RAM.
Now that we know how to get total and available memory from each of the nodes, we should combine the queries to get the percentage of the used memory of the whole cluster.
Please type the expression that follows, and press the Execute button.
1 -
sum(
  node_memory_MemAvailable_bytes
) /
sum(
  node_memory_MemTotal_bytes
)
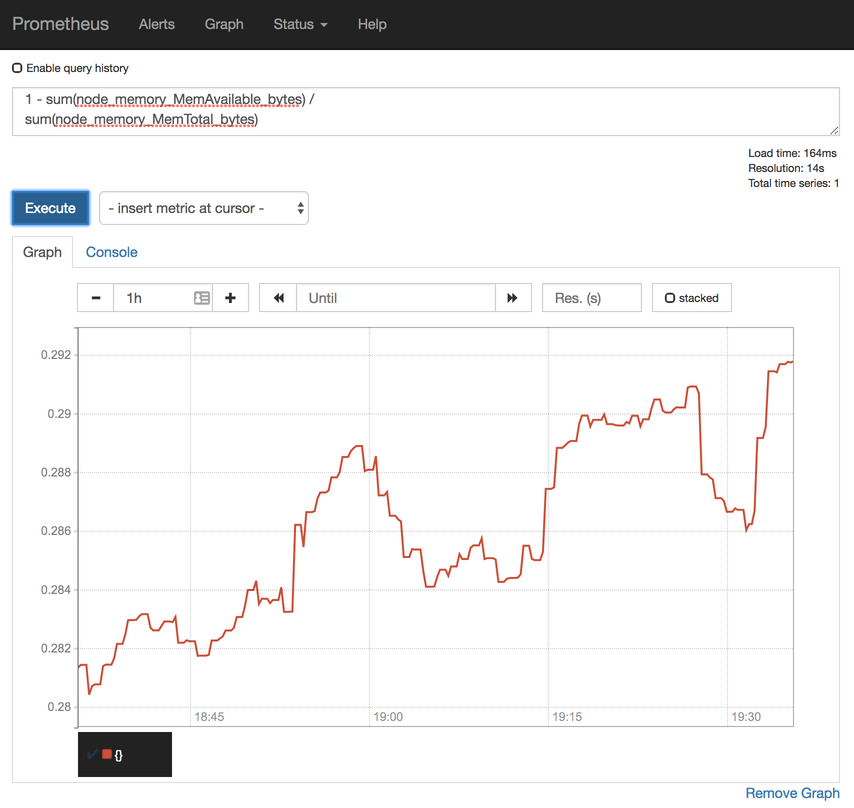
Since we are searching for the percentage of used memory, and we have the metric with available memory, we started the expression with 1 - that will invert the result. The rest of the expression is a simple division of available and total memory. In my case (screenshot below), less than thirty percent of memory is used on each of the nodes.
Measure allocatable memory#
Just as with CPU, available and total memory does not paint the whole picture. While that is useful information and a base for a potential alert, we also need to know how much memory is allocatable and how much of it is in use by Pods. We can get the first figure through the kube_node_status_allocatable_memory_bytes metric.
Please type the expression that follows, and press the Execute button.
kube_node_status_allocatable_memory_bytes
Depending on the Kubernetes flavor and the hosting provider you’re using, there might be a very small or a big discrepancy between the total and allocatable memory. I am running the cluster in AKS, and allocatable memory is a whole GB less than total memory. While the former is around 3GB RAM, the latter was approximately 4GB RAM. That’s a big difference. I do not have full 4GB for my Pods, but around one quarter less than that. The rest, around 1GB RAM, is spent on system-level services. To make things worse, that’s 1GB RAM spent on each node which, in my case, results in 3GB less in total since my cluster has three nodes. Given such a huge difference between the total and the allocatable amount of RAM, there is a clear benefit for having less number of bigger nodes. Still, not everyone needs big nodes and reducing their number to less than three might not be a good idea if we’d like to have our nodes spread in all the zones.
Measure requested memory for each of the applications#
Now that we know how to retrieve the amount of allocatable memory, let’s see how to get the amount of requested memory for each of the applications.
Please type the expression that follows, and press the Execute button.
kube_pod_container_resource_requests_memory_bytes
We can see that Prometheus (server) has the most requested memory (500 MB), with all the others being way below. Bear in mind that we are seeing only the Pods that have reservations. Those without are not present in the results of that query. As you already know, it is OK not to define reservations and limits only in exceptional cases like, for example, for short-lived Pods used in CI/CD processes.

The previous expression returned the amount of memory used by each Pod. However, our mission is to discover how much requested memory we have in the system as a whole.
Please type the expression that follows, and press the Execute button.
sum(
  kube_pod_container_resource_requests_memory_bytes
)
In my case, the total amount of requested memory is around 1.6GB RAM.
Total requested memory#
All that’s left is to divide the total requested memory with the amount of all the allocatable memory in the cluster.
Please type the expression that follows, and press the Execute button.
sum(
  kube_pod_container_resource_requests_memory_bytes
) /
sum(
  kube_node_status_allocatable_memory_bytes
)
In my case (screenshot below), the total of the requested memory is around twenty percent (0.2) of the cluster’s allocatable RAM. I am far from being in any type of danger, nor is there a need to scale up the cluster. If anything, I have too much unused memory and might want to scale down. However, we are at the moment only concerned with scaling up. Later we’ll explore alerts that might result in scaling down.

Let’s take a look at the differences between the old Chart’s values and those we are about to use.
diff mon/prom-values-cpu.yml \
    mon/prom-values-memory.yml
The output is as follows.
103a104,119
> - alert: NotEnoughMemory
>   expr: 1 - sum(node_memory_MemAvailable_bytes) / sum(node_memory_MemTotal_bytes) > 0.9
>   for: 30m
>   labels:
>     severity: notify
>   annotations:
>     summary: There's not enough memory
>     description: Memory usage of the cluster is above 90%
> - alert: TooMuchMemoryRequested
>   expr: sum(kube_pod_container_resource_requests_memory_bytes) / sum(kube_node_status_allocatable_memory_bytes) > 0.9
>   for: 30m
>   labels:
>     severity: notify
>   annotations:
>     summary: There's not enough allocatable memory
>     description: More than 90% of allocatable memory is requested
We added two new alerts (NotEnoughMemory and TooMuchMemoryRequested). The definitions themselves should be straightforward since we already created quite a few alerts. The expressions are the same as the ones we used in the Prometheus graph screen, with the addition of the greater than ninety percent (> 0.9) threshold. So, we’ll skip further explanation.
We’ll upgrade our Prometheus's Chart with the new values, and open the alerts screen to confirm that they
helm upgrade prometheus \
  stable/prometheus \
  --namespace metrics \
  --version 9.5.2 \
  --set server.ingress.hosts={$PROM_ADDR} \
  --set alertmanager.ingress.hosts={$AM_ADDR} \
  -f mon/prom-values-memory.yml

open "http://$PROM_ADDR/alerts"
If the alerts NotEnoughMemory and TooMuchMemoryRequested are not yet available, please wait a few moments, and refresh the screen.

Scale depending on CPU or memory usage#
The actions based on the memory-based alerts we created so far should be similar to those we discussed with CPU. We can use them to decide whether and when to scale up our cluster, either through manual actions or through automated scripts. Just as before, if we do have our cluster hosted with one of the vendors supported by the Cluster Autoscaler (CA), those alerts should be purely informative, while on-prem or with unsupported Cloud providers, they are much more than simple notifications. They are an indication that we are about to run out of capacity, at least where memory is concerned.
The CPU and memory examples are all focused on the need to know when the right time to scale our cluster is. We might create similar alerts that would notify us when the usage of CPU or memory is too low. That would give us a clear indication that we have too many nodes in the cluster and that we might want to remove some. That, again, assumes that we do not have Cluster Autoscaler up-and-running. Still, taking only CPU or only memory into account for scaling-down is too risky and can lead to unexpected results.
Let’s imagine that only twelve percent of the allocatable CPU is reserved and that we have three worker nodes in the cluster. Such a low CPU usage surely does not warrant that many nodes since on average, each has a relatively small amount of reserved CPU. As a result, we can choose to scale down, and we remove one of the nodes, allowing other clusters to reuse it. Was that a good thing to do? Well, it depends on other resources. If the percentage of memory reservations was low as well, removing a node was a good idea. On the other hand, if the reserved memory was over sixty-six percent, the removal of a node would result in insufficient resources. When we removed one of the three nodes, over sixty-six percent of reserved memory across three nodes became over one hundred percent on two nodes.
All in all, if we are to receive notifications that our cluster needs to scale down (and we do NOT have Cluster Autoscaler), we need to combine memory and CPU, and probably a few other metrics as alert thresholds. Fortunately, the expressions are very similar to those we used before. We just need to combine them into a single alert and change the thresholds.
Combine expressions and change the thresholds#
As a reminder, the expressions we used before are as follows (there’s no need to re-run them).
sum(rate(
  node_cpu_seconds_total{
    mode!="idle",
    mode!="iowait",
    mode!~"^(?:guest.*)$"
  }[5m]
))
by (instance) /
count(
  node_cpu_seconds_total{
    mode="system"
  }
)
by (instance)

1 -
sum(
  node_memory_MemAvailable_bytes
)
by (instance) /
sum(
  node_memory_MemTotal_bytes
)
by (instance)
Now, let’s compare yet another update of the Chart’s values with those we’re using right now.
diff mon/prom-values-memory.yml \
    mon/prom-values-cpu-memory.yml
The output is as follows.
119a120,127
> - alert: TooMuchCPUAndMemory
>   expr: (sum(rate(node_cpu_seconds_total{mode!="idle", mode!="iowait", mode!~"^(?:guest.*)$"}[5m])) by (instance) / count(node_cpu_seconds_total{mode="system"}) by (instance)) < 0.5 and (1 - sum(node_memory_MemAvailable_bytes) by (instance) / sum(node_memory_MemTotal_bytes) by (instance)) < 0.5
>   for: 30m
>   labels:
>     severity: notify
>   annotations:
>     summary: Too much unused CPU and memory
>     description: Less than 50% of CPU and 50% of memory is used on at least one node
We’re adding a new alert called TooMuchCPUAndMemory. It is a combination of the previous two alerts. It will fire only if both CPU and memory usage are below fifty percent. That way we’ll avoid sending false positives and we will not be tempted to descale the cluster only because one of the resource reservations (CPU or memory) is too low, while the other might be high.
All that’s left, before we move into the next subject (or metric-type), is to upgrade the Prometheus' Chart and confirm that the new alert is indeed operational.
helm upgrade prometheus \
  stable/prometheus \
  --namespace metrics \
  --version 9.5.2 \
  --set server.ingress.hosts={$PROM_ADDR} \
  --set alertmanager.ingress.hosts={$AM_ADDR} \
  -f mon/prom-values-cpu-memory.yml

open "http://$PROM_ADDR/alerts"
Please refresh the alerts screen if the alert is still not present. In my case (screenshot below), the total of reserved memory and CPU is below fifty percent, and the alert is in the pending state. In your case, that might not be true, and the alert might not have reached its threshold. Nevertheless, I’ll continue explaining my case, where both CPU and memory usage are less than fifty percent of the total available.
Thirty minutes later (for: 30m), the alert fired. It waited for a while (30m) to confirm that the drop in memory and CPU usage is not temporary. Given that I’m running my cluster in AKS, Cluster Autoscaler would remove one of the nodes long before thirty minutes. But, since it is configured to operate with a minimum of three nodes, CA will not perform that action. As a result, I might need to reconsider whether paying for three nodes is a worthwhile investment. If, on the other hand, my cluster is without Cluster Autoscaler, and assuming that I do not want to waste resources while other clusters might need more, I would need to remove one of the nodes (manually or automatically). If that removal was automatic, the destination would not be Slack, but the API of the tool in charge of removing nodes.

Now that we have a few examples of saturation, we covered each of the metrics championed by Google Site Reliability Engineers (SREs) and almost any other monitoring method. Still, we’re not done. There are a few other metrics and alerts I’d like to explore. They might not fall into any of the discussed categories, yet they might prove to be very useful. Let’s discuss that in the next lesson.
