Seeing Red Alerts in Action
This lesson will create a red alert and define the rules to forward alerts.
We'll cover the following
Creating a red alert#
Seeing inactive alerts is boring, so I want to show you one that fires (becomes red). To do that, we can add more nodes to the cluster (unless you’re using a single node cluster like Docker For Desktop and minikube). However, it would be easier to modify the expression of one of the alerts, so that’s what we’ll do next.
diff mon/prom-values-nodes.yml \
    mon/prom-values-nodes-0.yml
The output is as follows.
57,58c57,58
< expr: count(kube_node_info) > 3
< for: 15m
---
> expr: count(kube_node_info) > 0
> for: 1m
66c66
< for: 15m
---
> for: 1m
The new definition changed the condition of the TooManyNodes alert to fire if there are more than zero nodes. We also changed the for statement so that we do not need to wait for 15 minutes before the alert fires.
Let’s upgrade the Chart one more time.
helm upgrade prometheus \
  stable/prometheus \
  --namespace metrics \
  --version 9.5.2 \
  --set server.ingress.hosts={$PROM_ADDR} \
  --set alertmanager.ingress.hosts={$AM_ADDR} \
  -f mon/prom-values-nodes-0.yml
… and we’ll go back to the alerts screen.
open "http://$PROM_ADDR/alerts"
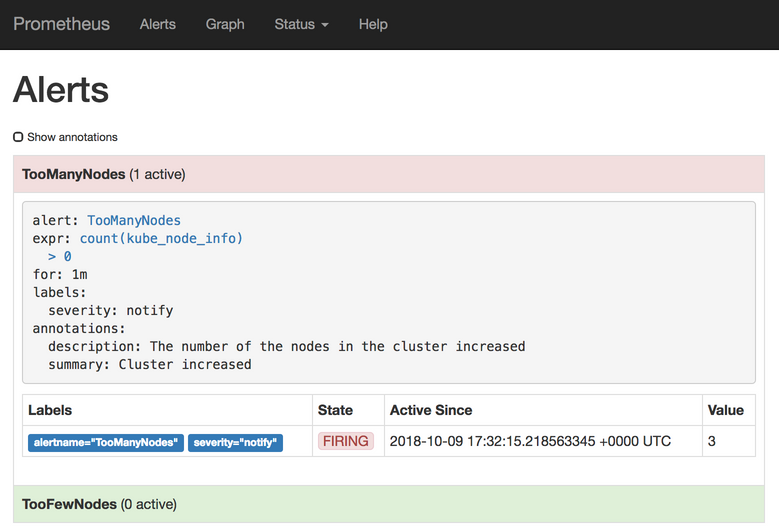
A few moments later (don’t forget to refresh the screen), the alert will switch to the pending state, and the color will change to yellow. That means that the conditions for the alert are met (we do have more than zero nodes) but the for period did not yet expire.
Wait for a minute (duration of the for period) and refresh the screen. The alert’s state switched to firing and the color changed to red. Prometheus sent our first alert.
Where was the alert sent? Prometheus Helm Chart deployed Alertmanager and pre-configured Prometheus to send its alerts there. Let’s take a look at its UI.
open "http://$AM_ADDR"
We can see that one alert reached Alertmanager. If we click the + info button next to the TooManyNodes alert, we’ll see the annotations (summary and description) as well as the labels (severity).

We are likely not going to sit in front of the Alertmanager waiting for issues to appear. If that was our goal, we could just as well wait for the alerts in Prometheus.
Displaying alerts is indeed not the reason why we have Alertmanager. It is supposed to receive alerts and dispatch them further. It is not doing anything of that sort simply because we did not yet define the rules it should use to forward alerts. That’s our next task.
Define rules to forward alerts#
We’ll take a look at yet another update of the Prometheus's Chart values.
diff mon/prom-values-nodes-0.yml \
    mon/prom-values-nodes-am.yml
The output is as follows.
71a72,93
> alertmanagerFiles:
>   alertmanager.yml:
>     global: {}
>     route:
>       group_wait: 10s
>       group_interval: 5m
>       receiver: slack
>       repeat_interval: 3h
>       routes:
>       - receiver: slack
>         repeat_interval: 5d
>         match:
>           severity: notify
>           frequency: low
>     receivers:
>     - name: slack
>       slack_configs:
>        - api_url: "https://hooks.slack.com/services/@T308SC7HD@/@BD8BU8TUH@/@FGPe7VI4ehPFYdLqopA8vxOi@"
>         send_resolved: true
>         title: "{{ .CommonAnnotations.summary }}"
>         text: "{{ .CommonAnnotations.description }}"
>         title_link: http://my-prometheus.com/alerts
When we apply that definition, we’ll add the alertmanager.yml file to Alertmanager. It contains the rules it should use to dispatch alerts. The route section contains general rules that will be applied to all alerts that do not match one of the routes. The group_wait value makes Alertmanager wait for 10 seconds in case additional alerts from the same group arrive. That way, we’ll avoid receiving multiple alerts of the same type.
When the first alert of a group is dispatched, it’ll use the value of the group_interval field (5m) before sending the next batch of the new alerts from the same group.
The receiver field in the route section defines the default destination of the alerts. Those destinations are defined in the receivers section below. In our case, we’re sending the alerts to the slack receiver by default.
The repeat_interval (set to 3h) defines the period after which alerts will be resent if Alertmanager continues receiving them.
routes section#
The routes section defines specific rules. Only if none of them match, those in the route section above will be used. The routes section inherits properties from above so only those that we define in this section will change. We’ll keep sending matching routes to slack, and the only change is the increase of the repeat_interval from 3h to 5d.
The critical part of the routes is the match section. It defines filters that are used to decide whether an alert is a match or not. In our case, only those with the labels severity: notify and frequency: low will be considered a match.
All in all, the alerts with the severity label set to notify and frequency set to low will be resent every five days. All the other alerts will have a frequency of three hours.
receivers section#
The last section of our Alertmanager config is receivers. We have only one receiver named slack. Below the name is slack_config. It contains a Slack-specific configuration. We could have used hipchat_config, pagerduty_config, or any other of the supported ones. Even if our destination is not one of those, we could always fall back to webhook_config and send a custom request to the API of our tool of choice.
🔍 For the list of all the supported
receivers, please consult the Alertmanager Configuration page.
Inside the slack_config section, we have the api_url that contains the Slack address with the token from one of the rooms in the devops20 channel.
Recently, Slack started monitoring public repositories and automatically removing API tokens that are exposed. To avoid that, I added
@characters to “fool” it. You’ll have to remove them (@characters) from this and other definitions that use my Slack tokens if you’d like to see the messages in my Slack channel. Otherwise, you’ll have to trust me that it would work if the token would be “real”.
🔍 For information on how to create an incoming webhook address for your Slack channel, please visit the Incoming Webhooks page.
Next is the send_resolved flag. When set to true, Alertmanager will send notifications not only when an alert is fired, but also when the issue that caused it is resolved.
We’re using summary annotation as the title of the message, and the description annotation for the text. Both are using Go Templates. Those are the same annotations we defined in the Prometheus's alerts.
Finally, the title_link is set to http://my-prometheus.com/alerts. That is indeed not the address of your Prometheus UI but, since I could not know in advance what be your domain is, I put a non-existing one. Feel free to change my-prometheus.com to the value of the environment variable $PROM_ADDR. Or just leave it as-is knowing that if you click the link, it will not take you to your Prometheus UI.
Now that we explored the Alertmanager configuration, we can proceed and upgrade the Chart.
helm upgrade prometheus \
    stable/prometheus \
    --namespace metrics \
    --version 9.5.2 \
    --set server.ingress.hosts={$PROM_ADDR} \
    --set alertmanager.ingress.hosts={$AM_ADDR} \
    -f mon/prom-values-nodes-am.yml
A few moments later, Alertmanager will be reconfigured, and the next time it receives the alert from Prometheus, it’ll dispatch it to Slack. We can confirm that by visiting the devops20.slack.com workspace.
open "https://devops20.slack.com/messages/CD8QJA8DS/"
You should see the Cluster increased notification. Don’t get confused if you see other messages. You are likely not the only one running the exercises from this course.

🔍 Sometimes, for reasons I could not figure out, Slack receives empty notifications from
Alertmanager. For now, I’m ignoring the issue out of laziness.
Now that we went through the basic usage of Prometheus and Alertmanager, we’ll take a break from hands-on exercises and discuss the types of metrics we might want to use, in the next lesson.
