Integrating IDEs with Jenkins X
This lesson explains how we can integrate IDEs with Jenkins X.
We'll cover the following
We saw that we could work with local files and let ksync synchronize them with DevPod. That allows us to work with our favorite IDE while reaping the benefits of having a full environment somewhere else. But that’s not all; we can integrate IDEs with Jenkins X.
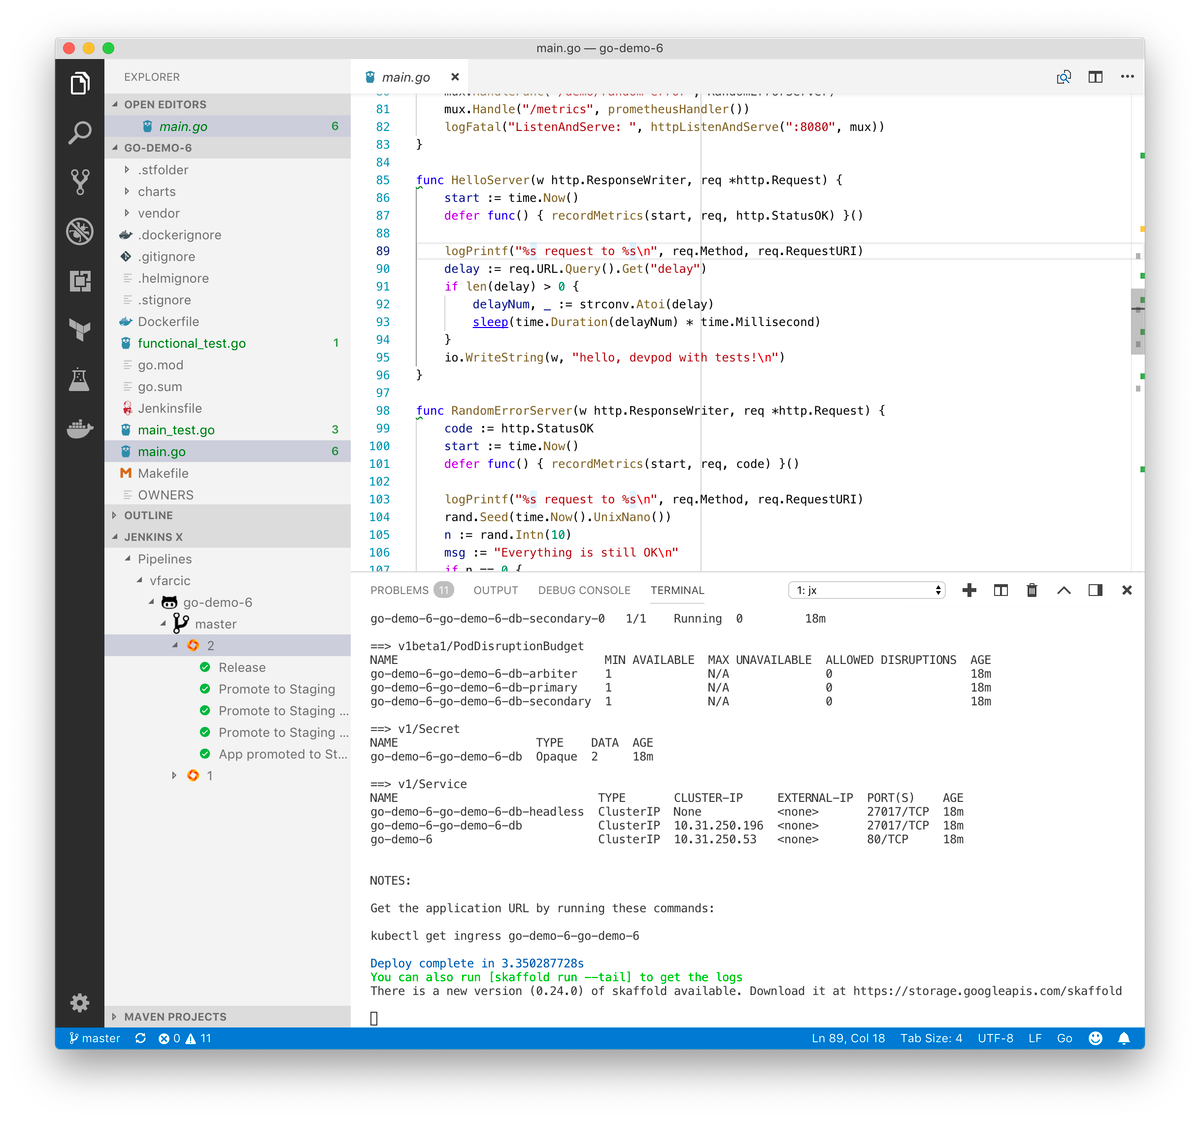
Do you remember the screenshot from the beginning of the chapter? That was the Visual Studio Code setup I used when working on the examples in this course. It’s repeated below in case you’re forgetful and you do not want to go back to see it again.
Let’s see if we can configure it in the same way on your laptop.
🔍 I’ll show you how to integrate Visual Studio Code with Jenkins X. If you prefer IntelliJ instead, the steps are very similar and I hope you will not have trouble setting it up. On the other hand, if you do not like either of the two, you’re in tough luck since those are the only ones supported so far . Nevertheless, I strongly recommend Visual Studio Code, and I urge you to try it out. It is my favorite and, in my opinion, it is superior to any other IDE.
⚠️ I could not configure the Jenkins X extension to Visual Studio Code to work with EKS. As far as I know, there is no place where we can define the environment variables required for authentication. Truth be told, I didn’t try too hard since I tend to work with GKE most of the time. Let me know if you solve that issue.
Integrating the Visual Studio Code with Jenkins X#
If you don’t already use Visual Studio Code, but you do want to try it out, please download it and install it from the official site.
With Visual Studio Code up-and-running, navigate to File > Open, select the go-demo-6 directory, and click the Open button.
Next, we need to install the jx extension. To do that, go to View > Extensions, search for jx, click the Install button in jx-tools. Once it is installed, click the Reload button.
Now that the extension is installed, we can display some useful information opening View > Explorer, and expanding the JENKINS X tab.
You will see a few general options by clicking the … button. Feel free to explore them.
More interesting information is available in the Pipelines section. Inside it should be your user; expand it, and you’ll see go-demo-6, with the master branch inside. Inside the master branch, you should see the builds executed for that project. If you expand one of them, you should notice the same steps as those we see when we execute jx get activity command. Some of them provide additional actions by clicking the right mouse button or two-finger click on Mac. They should be self-explanatory, so I’ll let you explore them on your own.
Finally, I would typically open a terminal session inside Visual Studio Code. You can do that by opening View > Integrated Terminal. Inside that terminal, I would execute the command that would create a DevPod for that project.
Now you have everything in one place. You can write your Code and see the Jenkins X activities as well as the output of watch.sh running in a DevPod. Isn’t that awesome?
Before we proceed, we’ll go out of the go-demo-6 directory.
Let’s wrap up the discussion of this chapter in the next lesson.
