
You are presented with some captured traffic from an internal network. Your job is to identify the various users and applications that were working in that network.
\nIdentify the network's users
\nIdentify protocols working within a network.
\nHow to use Wireshark to identify network activities.
\nHow to examine the headers and the payloads.
\nIdentifying and spotting different activities on the network.
\nTry to identify the various activities that took place in the network, during the period of time that this PCAP file includes. The provided PCAP file can be found at Desktop/Module7/Lab18/full_final.pcapng
\nFocus on HTTP traffic only and try to answer the following questions:
\nWhich was the first computer to issue an HTTP request?
\nWhat was the destination of this request?
\nCan you identify what site made the user request, by analyzing the PCAP file? Can you also identify the DNS server's IP address, by analyzing the PCAP file?
\nAnalyze the PCAP file and identify the first HTTP-related activity. Write down the source's and the destination's port regarding this HTTP activity and also write down the sequence number for both the server and the client.
\nCan you identify what happened? What is the IP and the MAC address of the client? Was this a normal DORA procedure or something abnormal happened? Also, write down the ports that were used and the utilized transport layer protocol.
\nWhich is the reason the ICMP messages within the PCAP were generated? Can you extract the IP addresses that were involved in those ICMP messages? What was the first packet's TTL?
\nThe ability to detect abnormal interactions within a pcap file is of paramount importance. Can you spot any other connection or data exchange other than the normal discovery protocols?
", "published_date": "2020-10-20T15:32:26Z", "solutions": "# Solutions\n\n## Task 1: General Overview of the PCAP File\n\nThe provided PCAP file can be found at **Desktop/Module7/Lab18/full_final.pcapng.**\n\nFirst, load this PCAP file into Wireshark.\n\nUsing the Wireshark protocol hierarchy option, we get a general overview of the protocols within the PCAP file.\n\n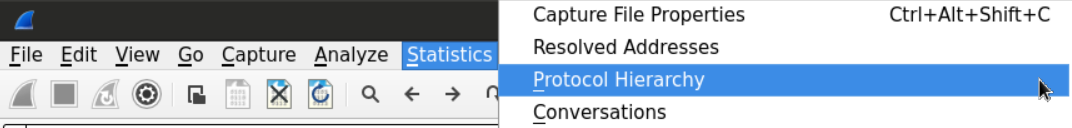\n\nLooking at the results, we can see that we have many well-known protocols such as DNS, DHCP, HTTP, and undefined protocol under the \"Data\" category.\n\n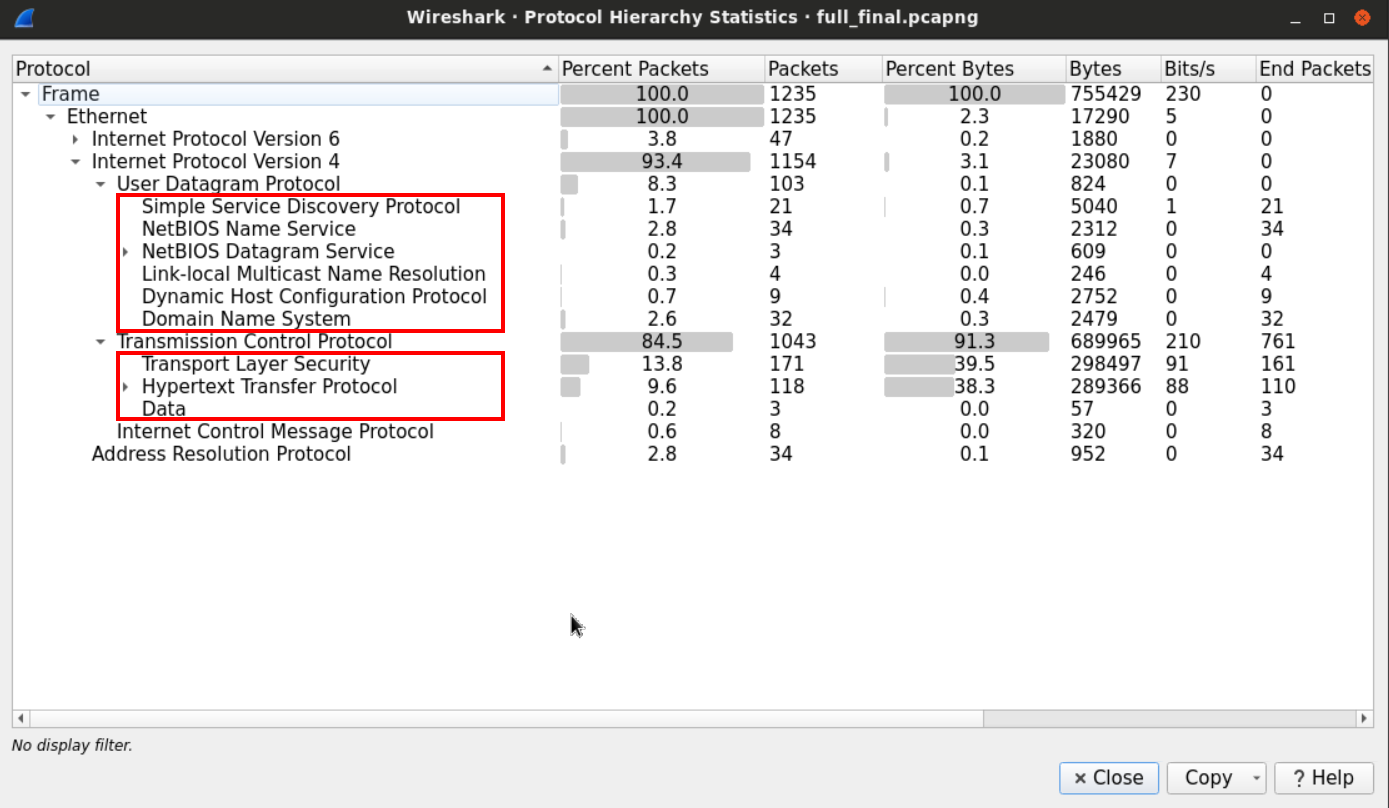\n\n## Task 2: Follow the HTTP Traffic \n\nWe can use the HTTP filter to only display the HTTP traffic.\n\n\n\nAnd view the packet details from the windows below:\n\n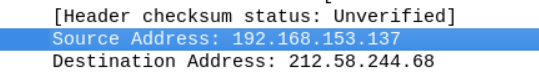\n\nThe first HTTP packet came from 192.168.153.137 and was going to 212.58.244.68.\n\n## Task 3: Check if you can extract user request-related information out of the PCAP file\n\nUsually, HTTP traffic is preceded by a DNS query to get the IP address of the site the user has requested.\n\nWe can use *go back* in the PCAP file and look for the requests which occurred before the HTTP request.\n\nAlternatively, we can filter for the DNS traffic using the DNS filter, and choose the packet with the closest sequence number to the HTTP's first packet.\n\n\n\nWe can see that the first HTTP packet has the sequence number 20.\n\nNow we need to examine the DNS traffic looking for the request that has occurred before this packet. \n\n\n\nIt seems that the closest DNS packet to precede the HTTP traffic packet number 20, is the DNS packet number 15 which originated from the client 192.168.153.137.\n\n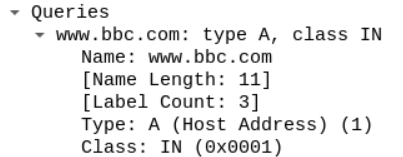\n\nThe client seems to ask about the [www.bbc.com](http://www.bbc.com) website and the server responded by sending the query with the appropriate response.\n\n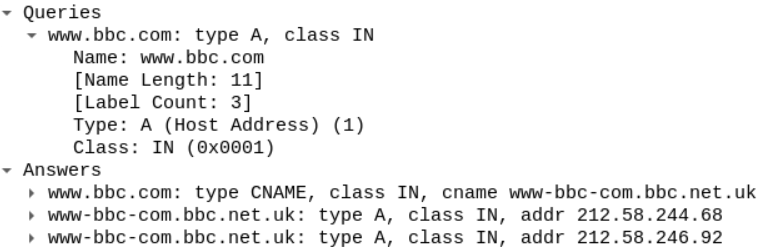\n\n## Task 4: Identify the Port where the first HTTP Activity Occurred \n\nSince the question is asking about ports and sequence numbers, let's follow it on the TCP level.\n\nThe DNS packet sequence number is 15, and the first HTTP packet's number was 20. So we should expect to find the TCP handshake between 15 and 20.\n\nThe order of the events should be:\n\n1. Sending the DNS query\n\n2. Starting the TCP handshake\n\n3. Sending the first HTTP request\n\n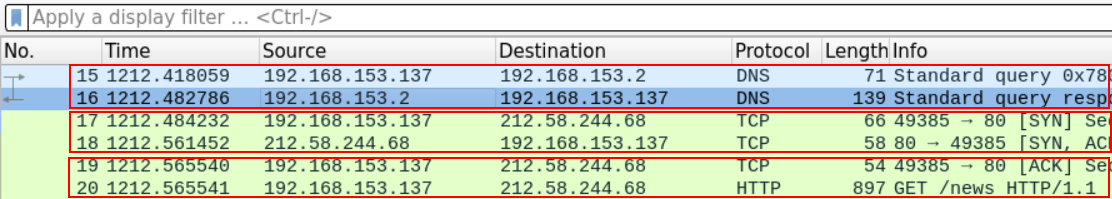\n\nLet's take a look at the first segment.\n\n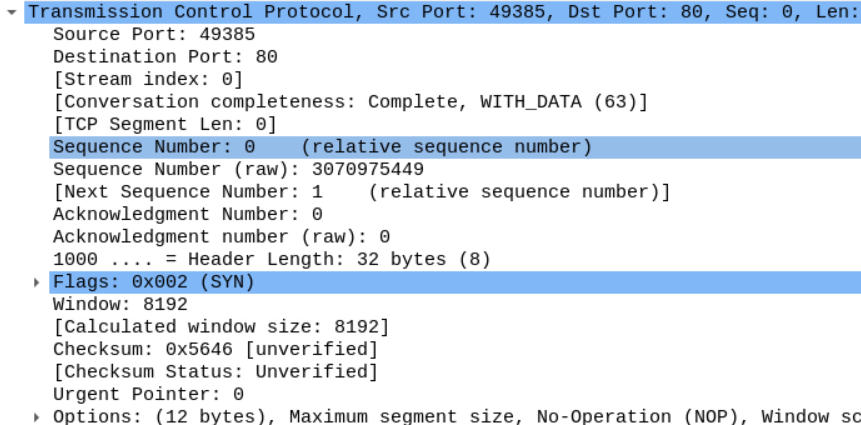\n\nYou can see the source port 49385 which our browser used to send the SYN segment. And the webserver is -typically- using port 80.\n\nWe can also examine the flags within that segment.\n\n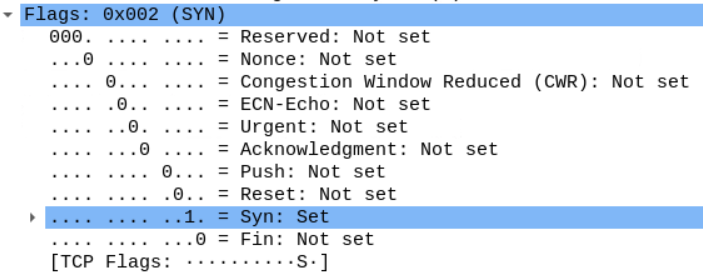\n\nLooking at that the sequence number, we see that Wireshark is telling us that the first segment has the sequence number 0 even though we know that it is supposed to be a random number.\n\nWireshark marks the first packet in a traffic flow starting from 0 to make it easier for the analyst to follow the stream.\n\n\n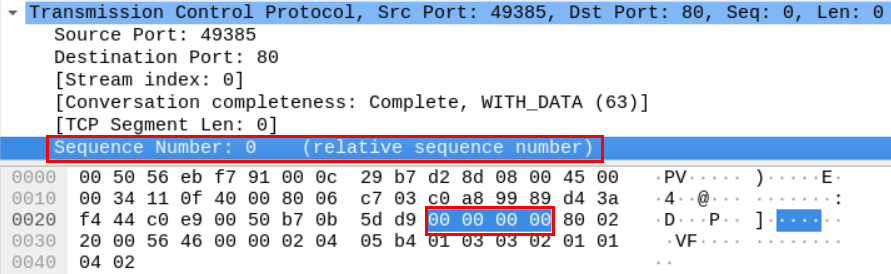\n\nIf we want to extract the actual sequence number, we need to go to the packet's hex dump in the window below.\n\nIf we translate the hex number below, we get the actual sequence number, which is 3070975449.\n\nNow, according to how TCP works, the server should acknowledge that segment with an ACK and its own sequence number.\n\n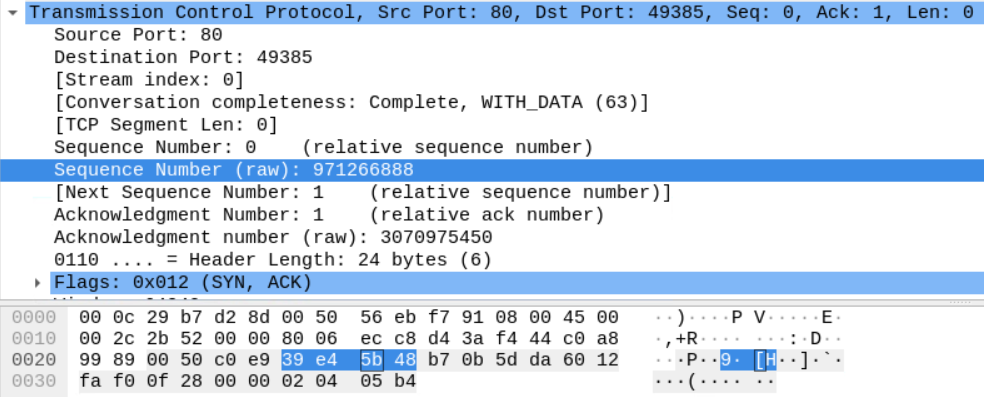\n\nHere we can see the server sending a segment with SYN and ACK flags as shown. \n\nThe server's sequence number is 971266888.\n\nAnd notice that the Server is sending the sequence number of the client's last received segment which is the b7 0b 5d da we saw earlier.\n\nThe final TCP segment sent by the client acknowledges the server's SYN segment.\n\n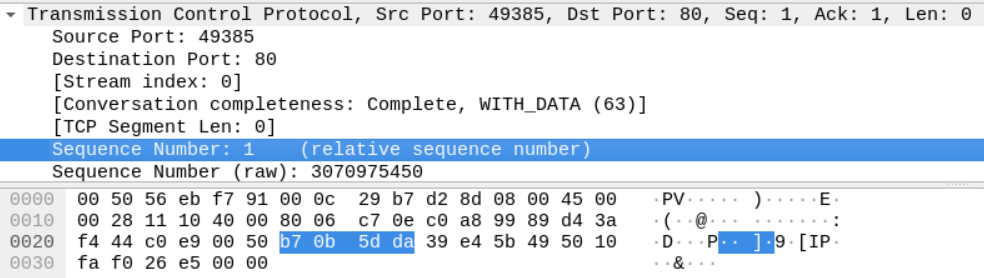\n\nThe Sequence number is b7 0b 5d da, which is the previous sequence number (b7 0b 5d d9) +1. The segment also has the server's last sequence number in the acknowledgment field (39 e4 5b 49).\n\n## Task 5: Isolate the DHCP Traffic and Analyze the Packets\n\nWe can use the bootp filter to display the DHCP filter, as follows.\n\n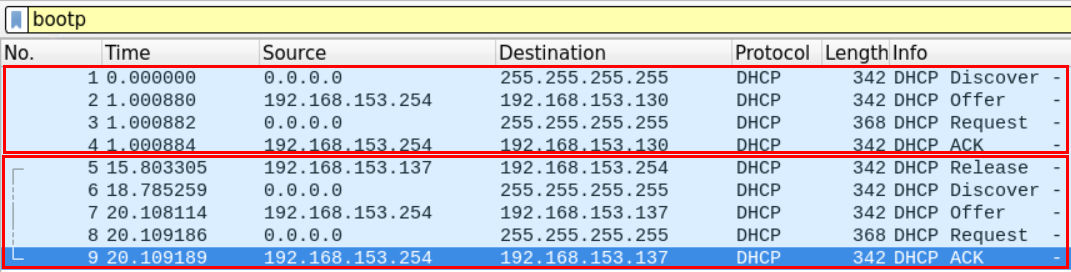\n\nIt seems that there are two DHCP cycles in the file. From the first look, we can see that a machine has requested an IP address, and another machine has released an IP address and re-requested an address.\n\nLet's analyze the first DHCP discover packet.\n\n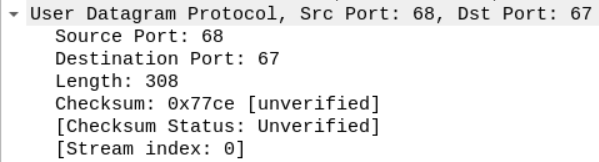\n\nWe can see that the DHCP request is encapsulated within a UDP datagram.\n\nThe datagram originated from Port 68, and the server seems to be listening on Port 67.\n\nWe can see that this packet came from the device with the mac address specified in the figure. \n\n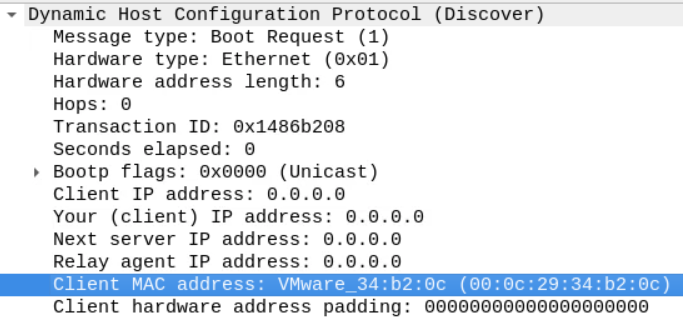\n\nAs mentioned earlier, we know that the DHCP process is usually initiated when the client sends a \"discover\" packet to the network.\n\nThis discover packet contains the IP address which the client wants to obtain from the server alongside the client's host name and mac address in the \"option\" section.\n\n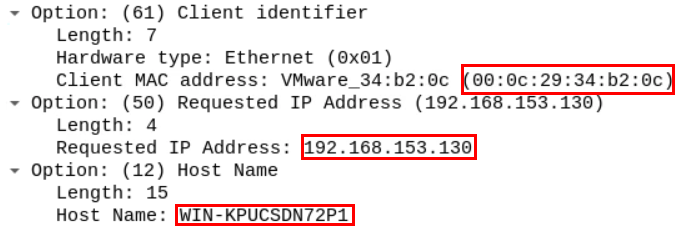\n\nThe server replies with a DHCP offer packet containing the server's IP address and the client assigned IP address.\n\n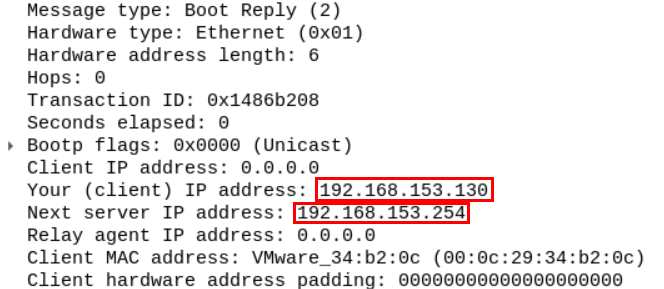\n\nThe offer also contains the lease time, which is the time the client can keep the IP address. After the lease time is over the client can request to keep that IP address for another period. The offer also contains the network subnet mask, DNS server, network's name, and its default gateway.\n\n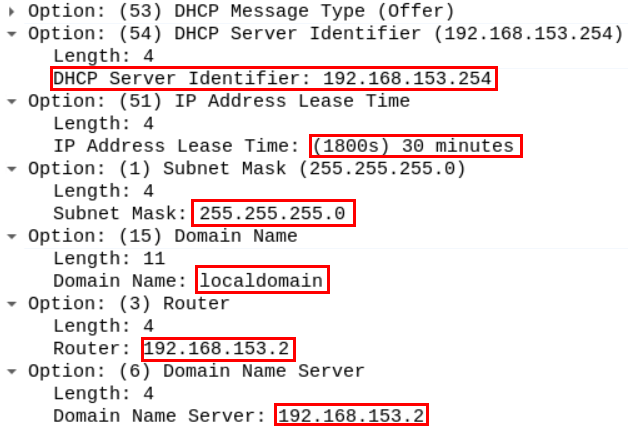\n\n## Task 6: Identify the Purpose of the ICMP Messages within the file\n\nJust like before we can filter the ICMP traffic using the ICMP filter in Wireshark\n\n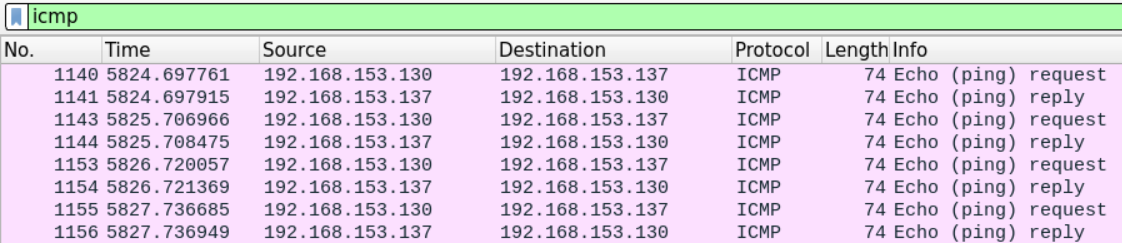\n\nEven without an in-depth examination of the packet, Wireshark description tells us that it's a PC pinging another PC.\n\nBy examining the content of the ICMP packet, we can extract the source and destination IP address (192.168.153.130 is pinging 192.168.153.137) as well as the time to live which equals 128.\n\n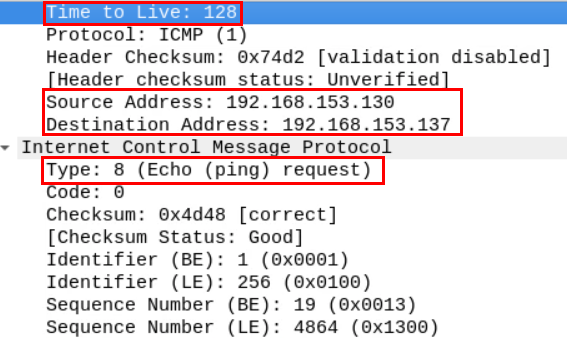\n\n## Task 7: Spot any Abnormalities within the PCAP file\n\nSometimes in a big file of packets, some custom connections may go unnoticed.\n\nWhen working in network forensics, you'll often encounter applications that implement their own application-layer protocol.\n\nThat means Wireshark will only show them as typical TCP stream without being able to recognize what type of data is being encapsulated.\n\nRecall that the data section we saw in the protocol hierarchy window, we opened at the beginning of this lab under the TCP section.\n\nThis suggests that non-standard application data was exchanged over the network.\n\n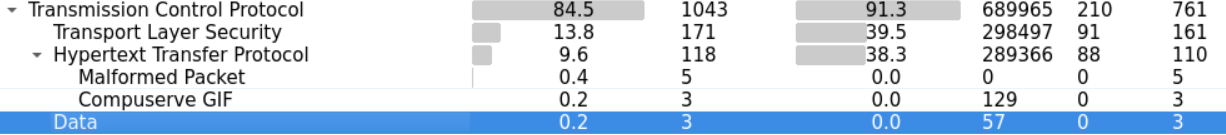\n\nWe can investigate that mystery by looking at more statistics on the conversations within our file.\n\n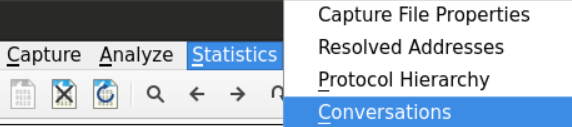\n\nWe can examine the TCP conversation and order them in respect to the destination port by clicking the TCP and Port B tabs respectively.\n\n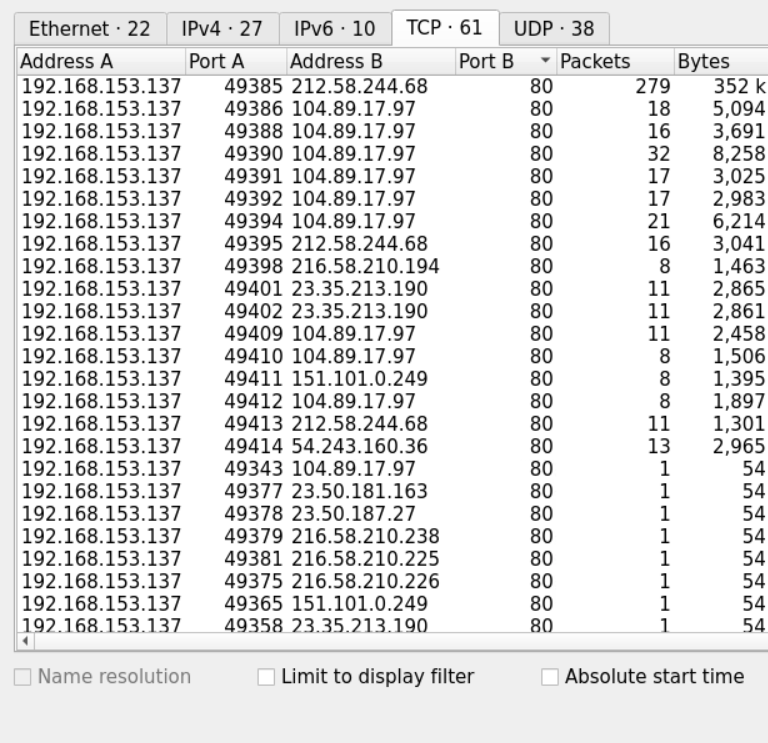\n\nWe can see that most of the connections we captured are going to either Port 80 or Port 443 which are normally used for HTTP and https connections.\n\nHowever, at the end of the file, we notice a connection going to a non-standard port which is 5555\n\n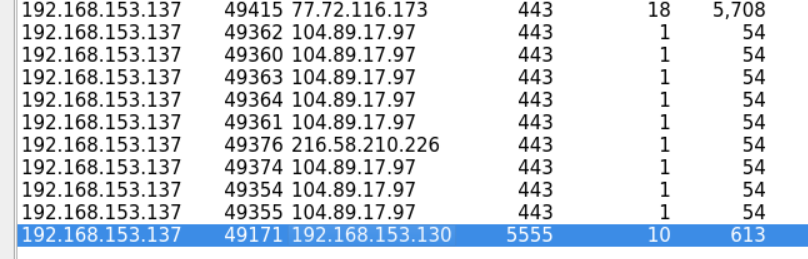\n\nWe can view the packets of that connection by filtering the packets that were going to or coming from port 5555.\n\nThe displayed packets show that after the TCP handshake there is a data exchange between the two communicating parties and then the connection is reset by the client who initiated.\n\nIn order to examine what sort of data was being exchanged between the communicating parties, we can use the **follow TCP stream** option to examine the data.\n\n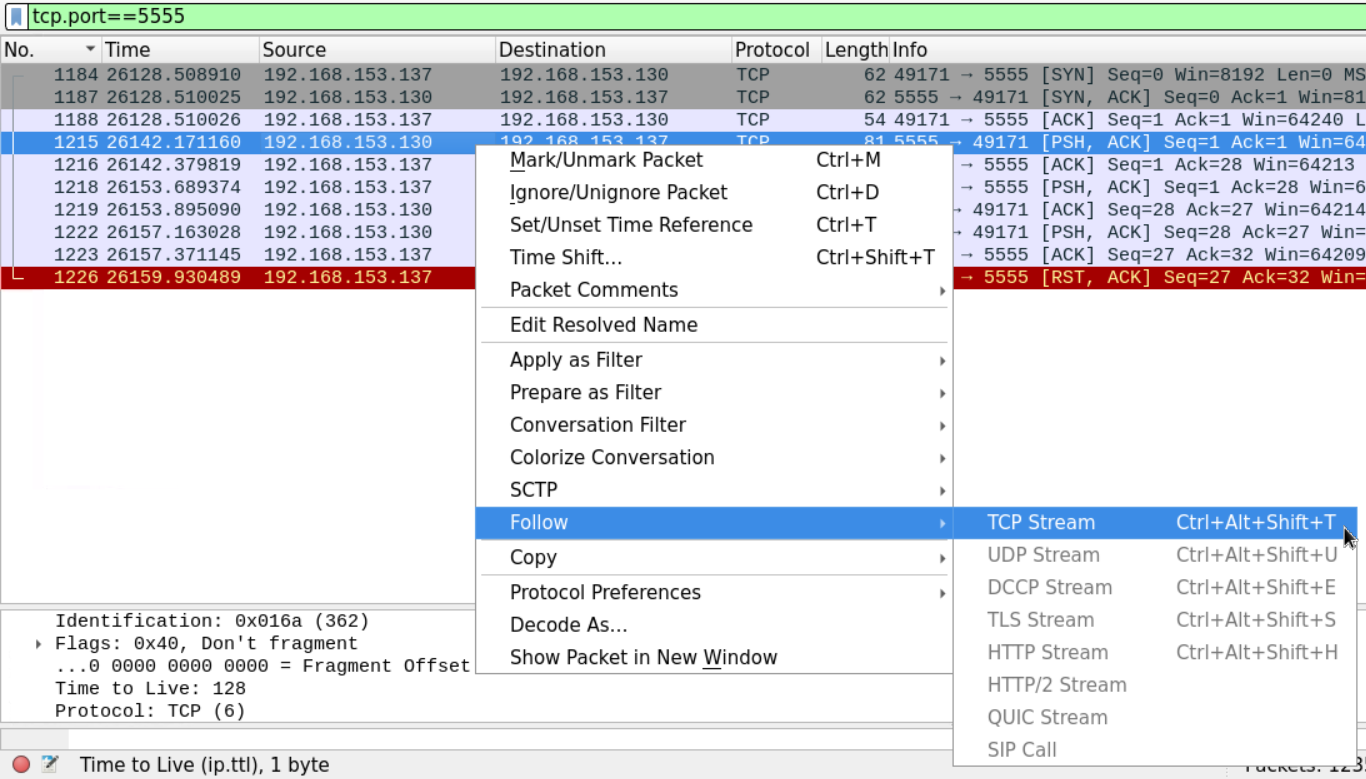\n\nThe stream shows what seems to be a custom chat application being used between the two machines.\n\n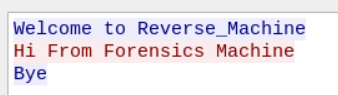", "solutions_html": "The provided PCAP file can be found at Desktop/Module7/Lab18/full_final.pcapng.
\nFirst, load this PCAP file into Wireshark.
\nUsing the Wireshark protocol hierarchy option, we get a general overview of the protocols within the PCAP file.
\n
Looking at the results, we can see that we have many well-known protocols such as DNS, DHCP, HTTP, and undefined protocol under the \"Data\" category.
\n
We can use the HTTP filter to only display the HTTP traffic.
\n
And view the packet details from the windows below:
\n
The first HTTP packet came from 192.168.153.137 and was going to 212.58.244.68.
\nUsually, HTTP traffic is preceded by a DNS query to get the IP address of the site the user has requested.
\nWe can use go back in the PCAP file and look for the requests which occurred before the HTTP request.
\nAlternatively, we can filter for the DNS traffic using the DNS filter, and choose the packet with the closest sequence number to the HTTP's first packet.
\n
We can see that the first HTTP packet has the sequence number 20.
\nNow we need to examine the DNS traffic looking for the request that has occurred before this packet.
\n
It seems that the closest DNS packet to precede the HTTP traffic packet number 20, is the DNS packet number 15 which originated from the client 192.168.153.137.
\n
The client seems to ask about the www.bbc.com website and the server responded by sending the query with the appropriate response.
\n
Since the question is asking about ports and sequence numbers, let's follow it on the TCP level.
\nThe DNS packet sequence number is 15, and the first HTTP packet's number was 20. So we should expect to find the TCP handshake between 15 and 20.
\nThe order of the events should be:
\nSending the DNS query
\nStarting the TCP handshake
\nSending the first HTTP request
\n
Let's take a look at the first segment.
\n
You can see the source port 49385 which our browser used to send the SYN segment. And the webserver is -typically- using port 80.
\nWe can also examine the flags within that segment.
\n
Looking at that the sequence number, we see that Wireshark is telling us that the first segment has the sequence number 0 even though we know that it is supposed to be a random number.
\nWireshark marks the first packet in a traffic flow starting from 0 to make it easier for the analyst to follow the stream.
\n
If we want to extract the actual sequence number, we need to go to the packet's hex dump in the window below.
\nIf we translate the hex number below, we get the actual sequence number, which is 3070975449.
\nNow, according to how TCP works, the server should acknowledge that segment with an ACK and its own sequence number.
\n
Here we can see the server sending a segment with SYN and ACK flags as shown.
\nThe server's sequence number is 971266888.
\nAnd notice that the Server is sending the sequence number of the client's last received segment which is the b7 0b 5d da we saw earlier.
\nThe final TCP segment sent by the client acknowledges the server's SYN segment.
\n
The Sequence number is b7 0b 5d da, which is the previous sequence number (b7 0b 5d d9) +1. The segment also has the server's last sequence number in the acknowledgment field (39 e4 5b 49).
\nWe can use the bootp filter to display the DHCP filter, as follows.
\n
It seems that there are two DHCP cycles in the file. From the first look, we can see that a machine has requested an IP address, and another machine has released an IP address and re-requested an address.
\nLet's analyze the first DHCP discover packet.
\n
We can see that the DHCP request is encapsulated within a UDP datagram.
\nThe datagram originated from Port 68, and the server seems to be listening on Port 67.
\nWe can see that this packet came from the device with the mac address specified in the figure.
\n
As mentioned earlier, we know that the DHCP process is usually initiated when the client sends a \"discover\" packet to the network.
\nThis discover packet contains the IP address which the client wants to obtain from the server alongside the client's host name and mac address in the \"option\" section.
\n
The server replies with a DHCP offer packet containing the server's IP address and the client assigned IP address.
\n
The offer also contains the lease time, which is the time the client can keep the IP address. After the lease time is over the client can request to keep that IP address for another period. The offer also contains the network subnet mask, DNS server, network's name, and its default gateway.
\n
Just like before we can filter the ICMP traffic using the ICMP filter in Wireshark
\n
Even without an in-depth examination of the packet, Wireshark description tells us that it's a PC pinging another PC.
\nBy examining the content of the ICMP packet, we can extract the source and destination IP address (192.168.153.130 is pinging 192.168.153.137) as well as the time to live which equals 128.
\n
Sometimes in a big file of packets, some custom connections may go unnoticed.
\nWhen working in network forensics, you'll often encounter applications that implement their own application-layer protocol.
\nThat means Wireshark will only show them as typical TCP stream without being able to recognize what type of data is being encapsulated.
\nRecall that the data section we saw in the protocol hierarchy window, we opened at the beginning of this lab under the TCP section.
\nThis suggests that non-standard application data was exchanged over the network.
\n
We can investigate that mystery by looking at more statistics on the conversations within our file.
\n
We can examine the TCP conversation and order them in respect to the destination port by clicking the TCP and Port B tabs respectively.
\n
We can see that most of the connections we captured are going to either Port 80 or Port 443 which are normally used for HTTP and https connections.
\nHowever, at the end of the file, we notice a connection going to a non-standard port which is 5555
\n
We can view the packets of that connection by filtering the packets that were going to or coming from port 5555.
\nThe displayed packets show that after the TCP handshake there is a data exchange between the two communicating parties and then the connection is reset by the client who initiated.
\nIn order to examine what sort of data was being exchanged between the communicating parties, we can use the follow TCP stream option to examine the data.
\n
The stream shows what seems to be a custom chat application being used between the two machines.
\n