
You are presented with captured traffic from an internal network. Your job is to identify the various users and applications that were working in that network.
\nThe provided PCAP file can be found at Desktop/Module7/Lab19/Network_analysis_lab_Full.pcapng.
\nTo which protocols do the captured packets belong to? What is the most used application layer protocol?
\nHow many users can you identify, inside this PCAP file? What can you tell about them, by analyzing their generated traffic?
\nExplore the different Wireshark functionalities to extract HTTP-related information.
\nApply the appropriate filter to focus on IMAP and SMTP traffic.
", "published_date": "2020-10-20T15:32:26Z", "solutions": "# Solutions \n\n## Task 1: Perform Protocol Statistics\n\nThe provided PCAP file can be found at **Desktop/Module7/Lab19/Network_analysis_lab_Full.pcapng**\n\nFirst, load this PCAP file into Wireshark.\n\nWireshark has a built-in statistical tool which allows us to get a general overview of the protocols which the captured packets belong to.\n\nThis is accessible from **Statistics -> Protocol Hierarchy**\n\n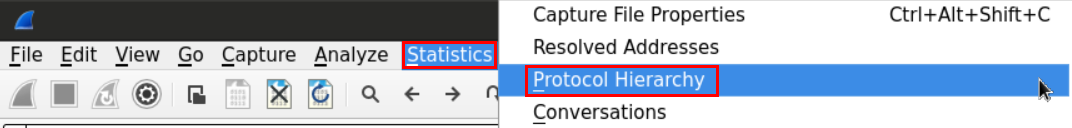\n\n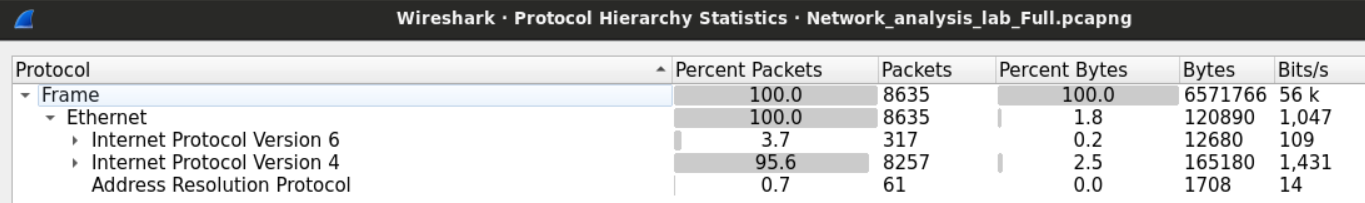\n\nWe can see that the frames we captured can be categorized into three groups; IPV4, IPV6, and ARP frames.\n\nWe can see in the second column (percent packets) that IPV4 packets make more than 95% of the captured packets.\n\n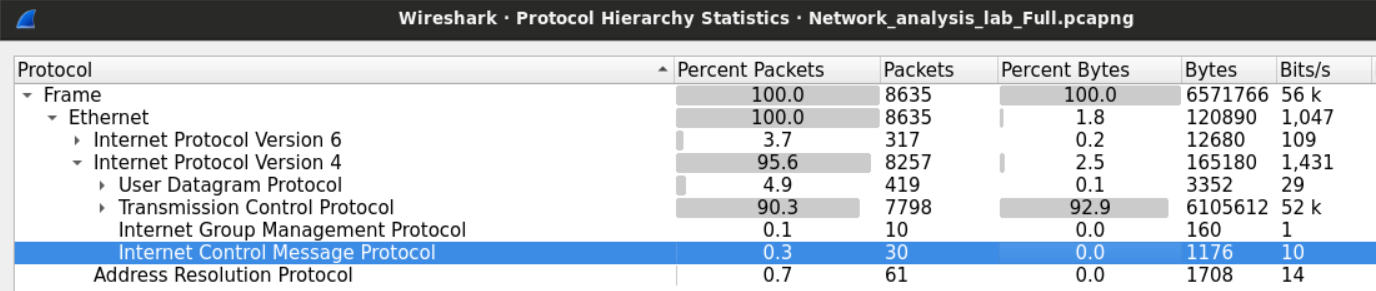\n\nTCP constitutes 95% of the IPV4 packets while UDP 5% and the rest is between **ICMP** and **IGMP** protocols.\n\n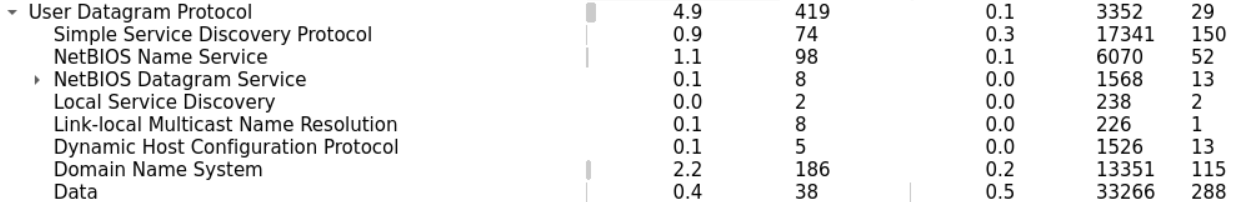\n\nLet's start with UDP since it should be easier. Within the UDP section, we can notice few known application layer protocols. Namely **DNS** and **Bootstrap** (DHCP).\n\nWe can also find less known protocols such as **NetBIOS** (for name registration) and **SSDP** (HTTP based protocol for network service discovery).\n\n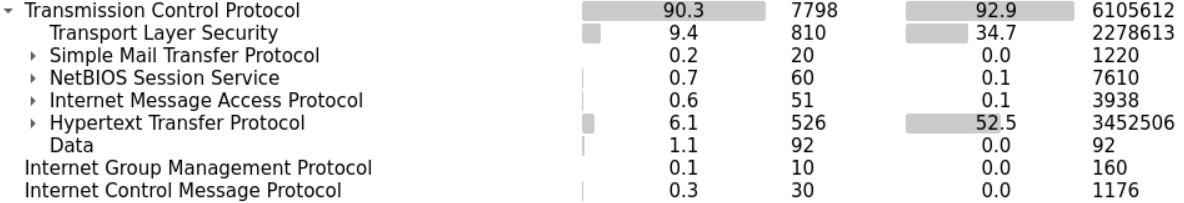\n\nIn the TCP section, we have **SMTP** and **IMAP** (which suggests their mail exchange activities). **HTTP** and **SSL** tell us that there is web browsing activity.\n\nWe can examine few statistics about the HTTP traffic within the file.\n\nThis tells us what type of files were exchanged over HTTP.\n\n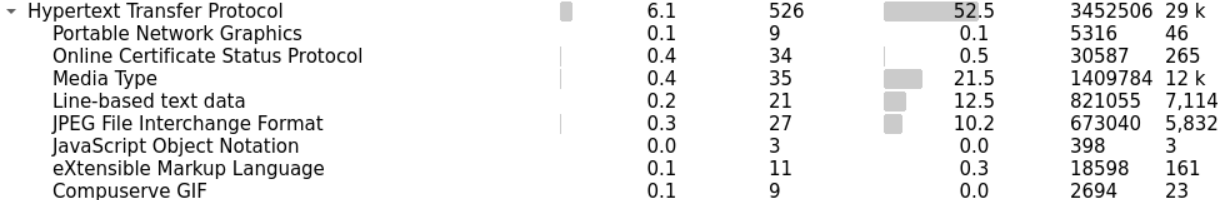\n\n## Task 2: Identify the Number of Users and Study their Traffic Habits\n\nOne way we can count how many users are within the network is by sorting the packets we have based on the IP address and picking the private IPv4 addresses. Sorting the addresses will make it easy for us to identify different addresses.\n\nAlternatively, we can use the statistical feature again in Wireshark to extract all the addresses within the capture file.\n\n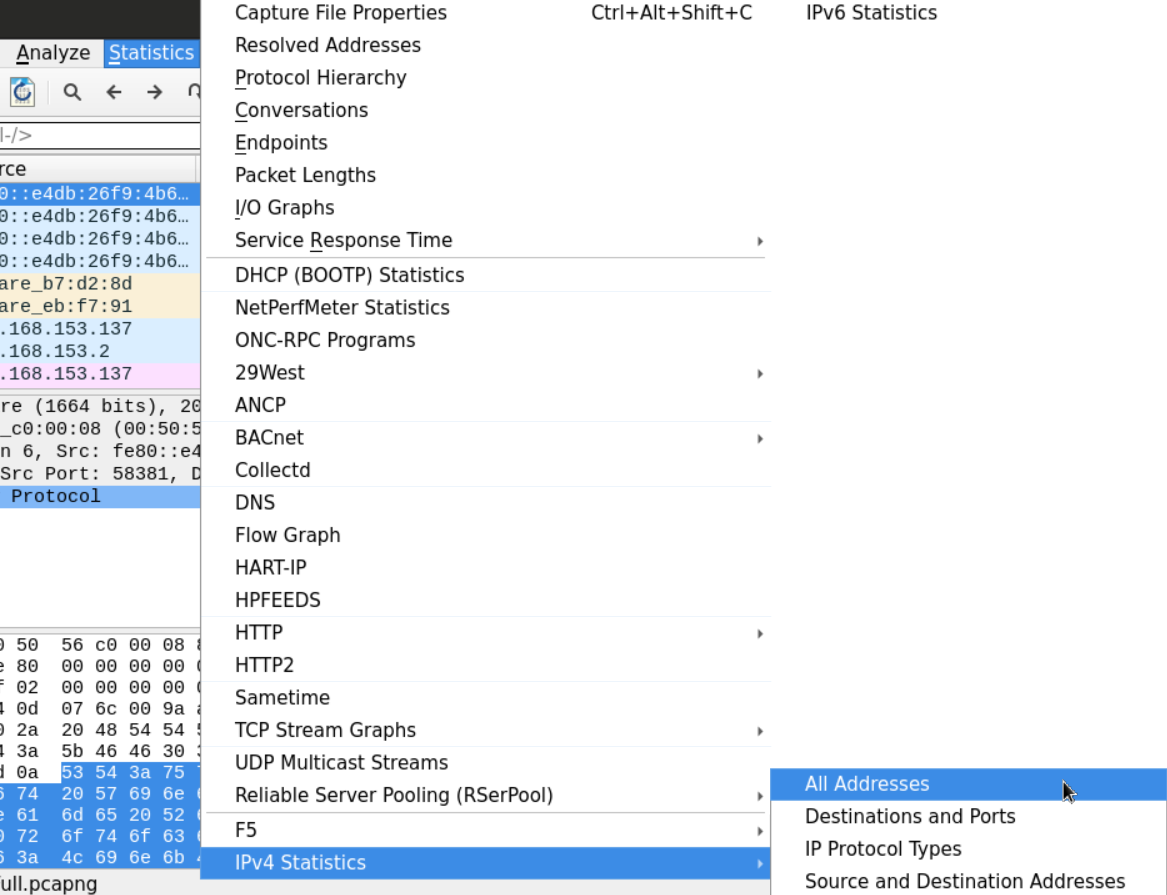\n\n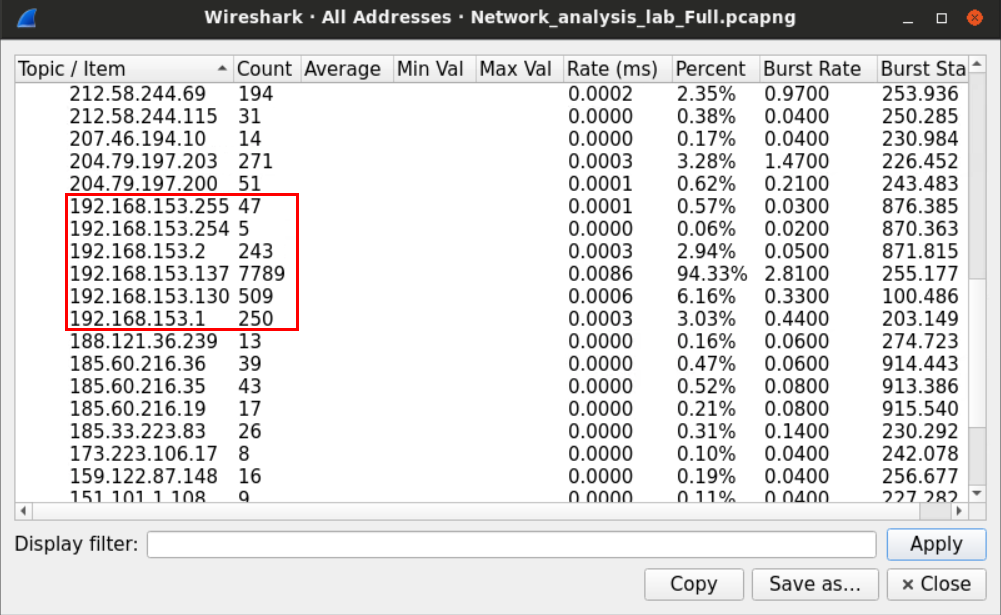\n\nAfter sorting the IP addresses, we can look for the IPV4 private range which, in small networks, usually starts with **192.168.**\n\nThe IP that ends with 255 is called the **broadcast** address, which is used when a device wants to send something to the whole network.\n\nSometimes, packets can tell us a lot about the operating systems they came from.\n\nFields such as \"**TTL,\"** for example, may be used to identify the machine's OS.\n\nOn most modern Windows machines, the default **Time-to-Live** is 128, while the default value for most Linux distributions is 64. Cisco IOS, on the other hand, uses the value 254 as the default TTL.\n\nOn a higher layer, HTTP headers, specifically, the **user-agent** may also be used to identify the user's OS.\n\nIn our example, we can look for HTTP traffic that originated from one of the private IPv4 addresses we found earlier using Wireshark filter.\n\n```\nhttp and ip.src==192.168.153.137\n```\n\n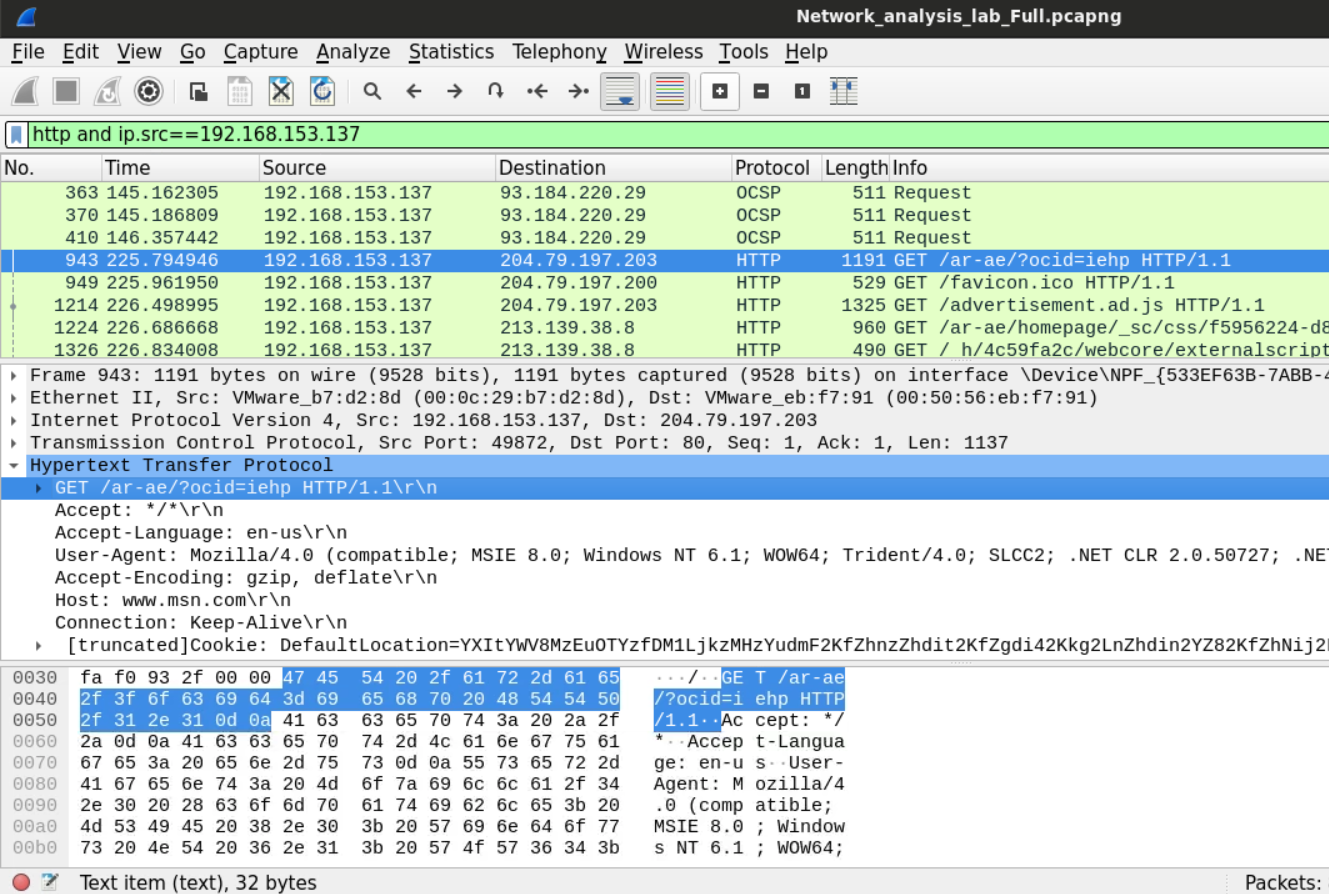\n\nLooking at the user-agent header, we now know that the machine **192.168.153.137** is Windows NT 6.1 (Windows 7) machine.\n\n## Task 3: Analyze and Describe the Users' Web Activities \n\nIf we want to analyze the user's web activities, we need to find a way to know what websites the users have requested.\n\nThe not-very-smart way to do this would be to filter the traffic we have and examine the HTTP traffic only. Using the filter `http`. After that, we can follow the HTTP streams for the packets we have.\n\n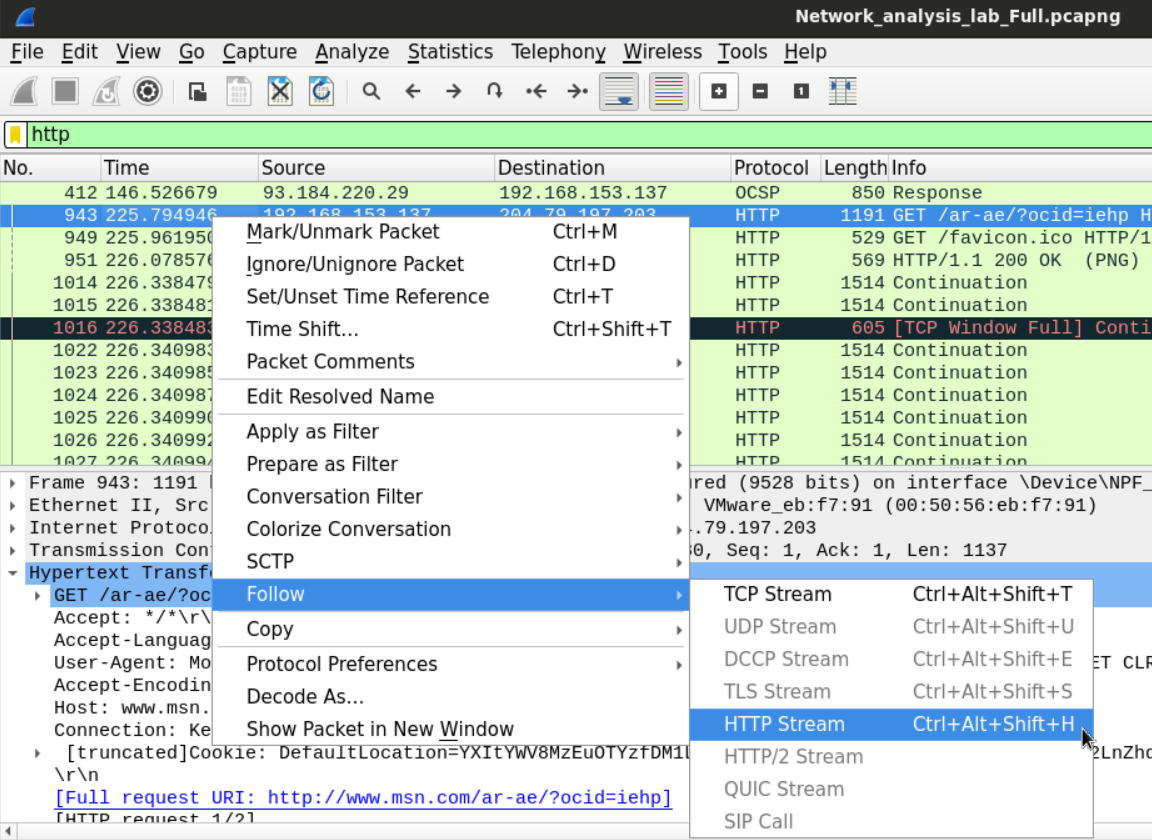\n\nThis is a slightly smarter way is to filter the DNS requests that were made by the users. Since HTTP requests usually get preceded by DNS query asking about the IP of the destination domain, examining the DNS queries that are requesting records of Type A could help know what domains were accessed by the users. Using filter `dns.a`.\n\n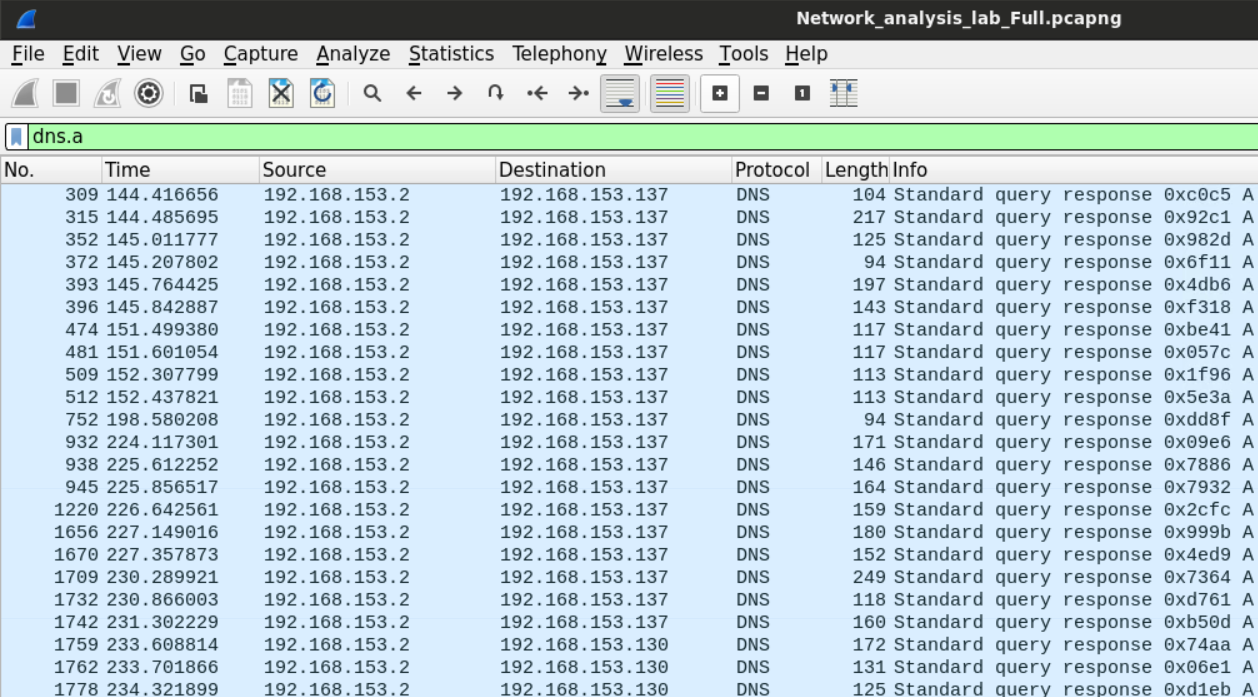\n\nThe other way to do this is to look for the HTTP statistics so we can tell which domains were accessed by the users.\n\n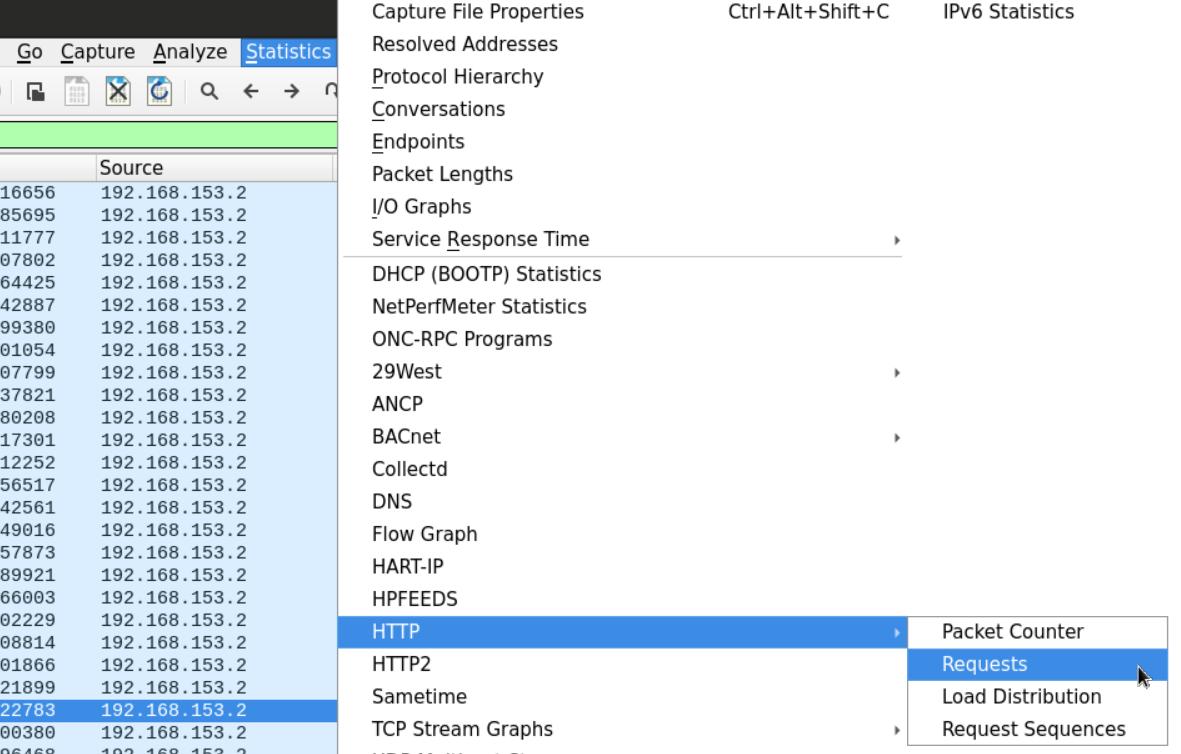\n\nThe display window will show us the domains and sub-domains requested by the users.\n\n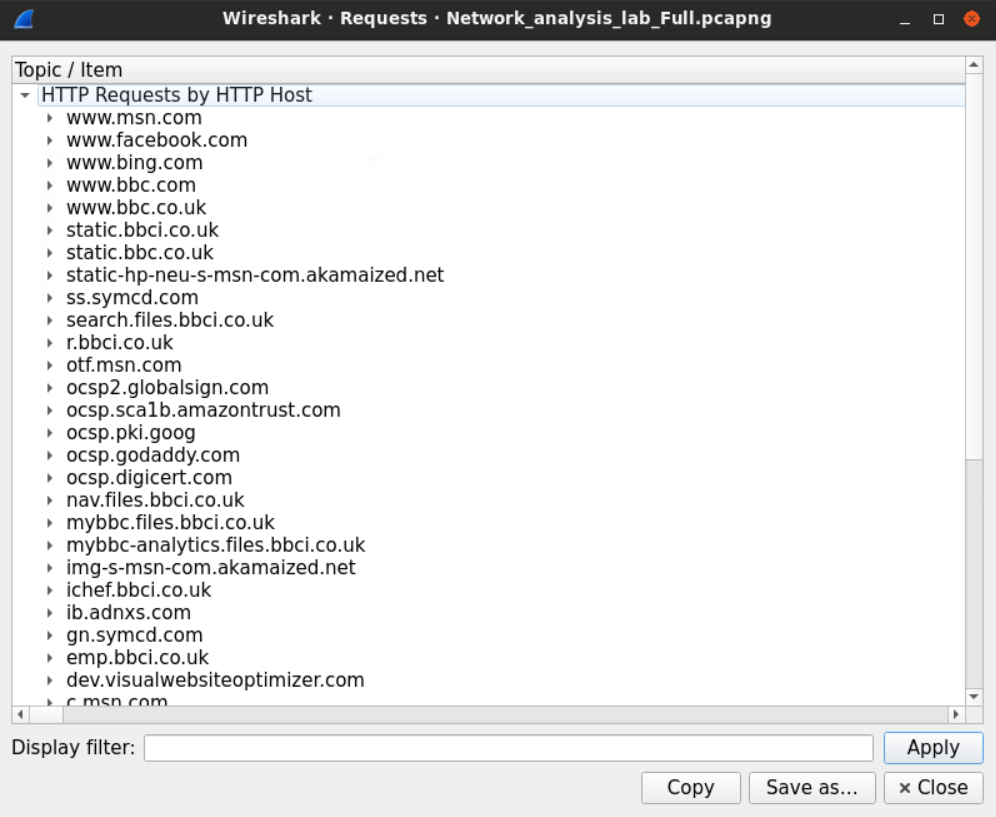\n\nWe can click on any displayed domain to get the exact URL that was requested by the user. For example, we can notice that the user has downloaded a file from the BBC website.\n\n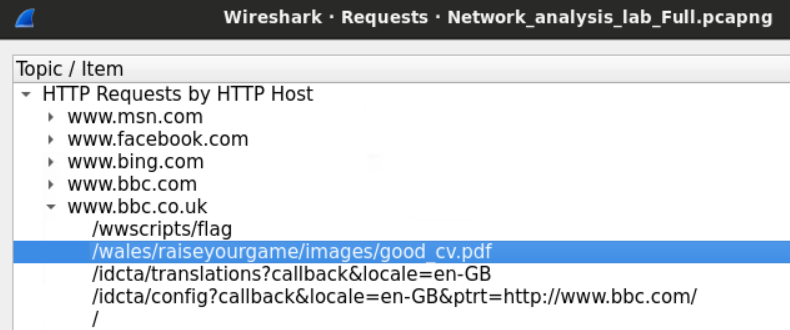\n\nWe'll get on how to extract that file later.\n\n# Task 4: Analyze and Describe the User's Mailing Activities\n\nAs discussed earlier, there are two protocols for working with emails; **SMTP** and **IMAP**. The latter is used to access to mailbox and view email, while the first is used to send emails. We'll examine the login process first using the ```imap``` filter in Wireshark and view the TCP stream option.\n\n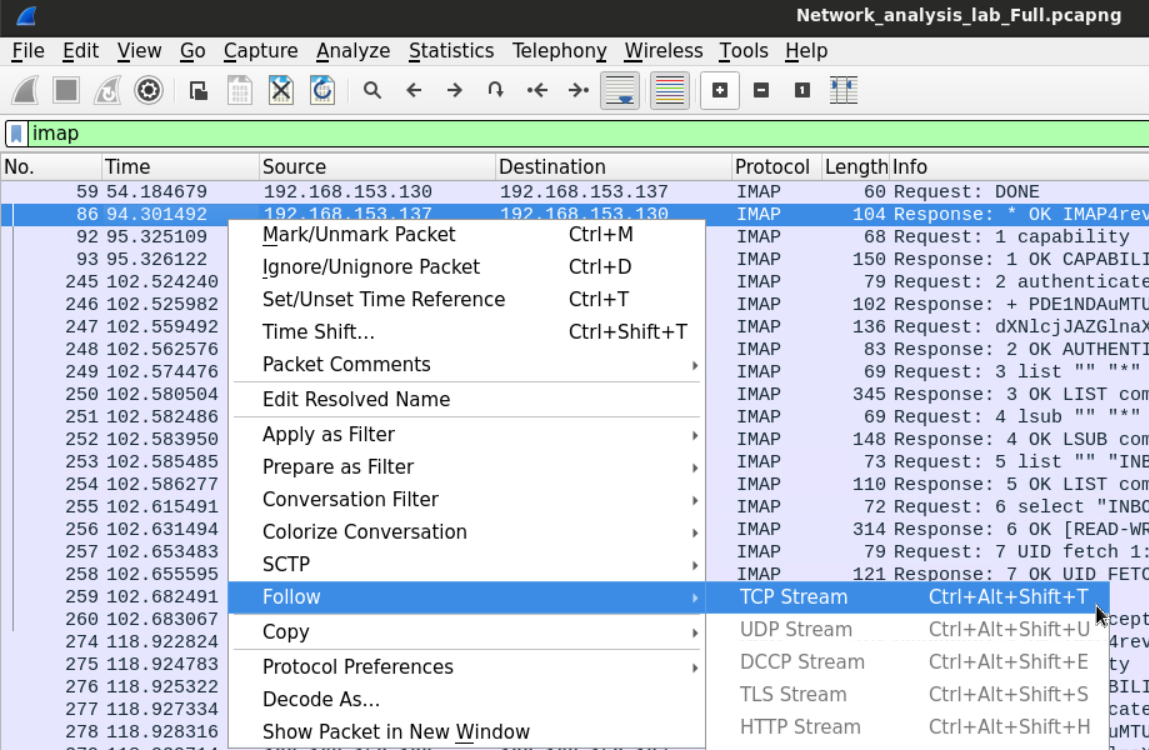\n\nThe connection starts with the server displaying its time.\n\nThe client requests the server capabilities which the server replies to by sending a list of possible operations.\n\nThe client requests a challenge-response md5 based authentication.\n\nChallenge response protocol differs from password-based authentication protocol in that the first doesn't send the password itself instead of the server since a challenge to the client cannot be solved unless the client has the right password.\n\nThe server sends the challenge in base 64 encoding, and the client sends their response for the challenge using the same encoding scheme.\n\nSince the user supplied the right password, the server replies with an okay message telling the user that the authentication has been successful.\n\nLater that client requests to view his mailbox including the inbox, junk box, trash, etc.\n\n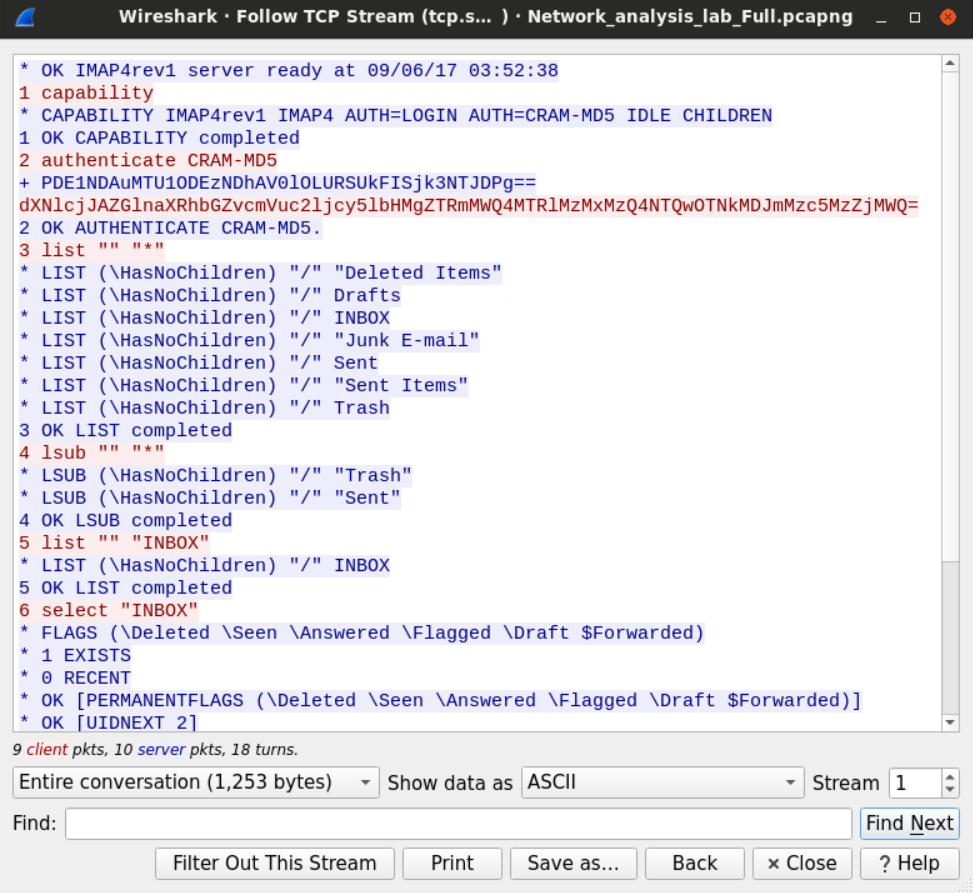\n\nUsing the same methodology, we can filter for SMTP protocol tickets to see the emails that were sent during the capture. We need to replace the imap filter with an SMTP filter and view the TCP stream.\n\n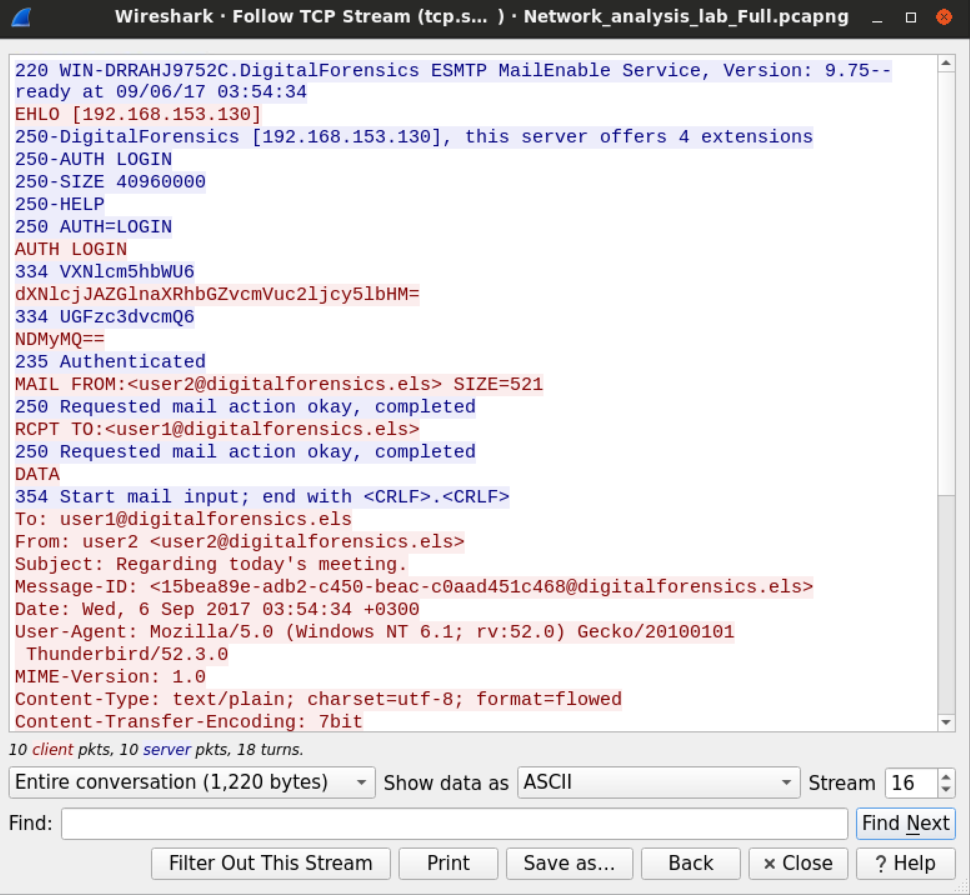\n\nThe session also starts with the server sending its banner and its time to the client.\n\nThe client replies for the better with the extended hello command.\n\nThe server offers different operations for the client to choose from.\n\nAs we saw earlier the client authenticate using its username and password and then it sends an email to user2 asking them to delay an appointment", "solutions_html": "The provided PCAP file can be found at Desktop/Module7/Lab19/Network_analysis_lab_Full.pcapng
\nFirst, load this PCAP file into Wireshark.
\nWireshark has a built-in statistical tool which allows us to get a general overview of the protocols which the captured packets belong to.
\nThis is accessible from Statistics -> Protocol Hierarchy
\n

We can see that the frames we captured can be categorized into three groups; IPV4, IPV6, and ARP frames.
\nWe can see in the second column (percent packets) that IPV4 packets make more than 95% of the captured packets.
\n
TCP constitutes 95% of the IPV4 packets while UDP 5% and the rest is between ICMP and IGMP protocols.
\n
Let's start with UDP since it should be easier. Within the UDP section, we can notice few known application layer protocols. Namely DNS and Bootstrap (DHCP).
\nWe can also find less known protocols such as NetBIOS (for name registration) and SSDP (HTTP based protocol for network service discovery).
\n
In the TCP section, we have SMTP and IMAP (which suggests their mail exchange activities). HTTP and SSL tell us that there is web browsing activity.
\nWe can examine few statistics about the HTTP traffic within the file.
\nThis tells us what type of files were exchanged over HTTP.
\n
One way we can count how many users are within the network is by sorting the packets we have based on the IP address and picking the private IPv4 addresses. Sorting the addresses will make it easy for us to identify different addresses.
\nAlternatively, we can use the statistical feature again in Wireshark to extract all the addresses within the capture file.
\n

After sorting the IP addresses, we can look for the IPV4 private range which, in small networks, usually starts with 192.168.
\nThe IP that ends with 255 is called the broadcast address, which is used when a device wants to send something to the whole network.
\nSometimes, packets can tell us a lot about the operating systems they came from.
\nFields such as \"TTL,\" for example, may be used to identify the machine's OS.
\nOn most modern Windows machines, the default Time-to-Live is 128, while the default value for most Linux distributions is 64. Cisco IOS, on the other hand, uses the value 254 as the default TTL.
\nOn a higher layer, HTTP headers, specifically, the user-agent may also be used to identify the user's OS.
\nIn our example, we can look for HTTP traffic that originated from one of the private IPv4 addresses we found earlier using Wireshark filter.
\nhttp and ip.src==192.168.153.137
Looking at the user-agent header, we now know that the machine 192.168.153.137 is Windows NT 6.1 (Windows 7) machine.
\nIf we want to analyze the user's web activities, we need to find a way to know what websites the users have requested.
\nThe not-very-smart way to do this would be to filter the traffic we have and examine the HTTP traffic only. Using the filter http. After that, we can follow the HTTP streams for the packets we have.

This is a slightly smarter way is to filter the DNS requests that were made by the users. Since HTTP requests usually get preceded by DNS query asking about the IP of the destination domain, examining the DNS queries that are requesting records of Type A could help know what domains were accessed by the users. Using filter dns.a.

The other way to do this is to look for the HTTP statistics so we can tell which domains were accessed by the users.
\n
The display window will show us the domains and sub-domains requested by the users.
\n
We can click on any displayed domain to get the exact URL that was requested by the user. For example, we can notice that the user has downloaded a file from the BBC website.
\n
We'll get on how to extract that file later.
\nAs discussed earlier, there are two protocols for working with emails; SMTP and IMAP. The latter is used to access to mailbox and view email, while the first is used to send emails. We'll examine the login process first using the imap filter in Wireshark and view the TCP stream option.

The connection starts with the server displaying its time.
\nThe client requests the server capabilities which the server replies to by sending a list of possible operations.
\nThe client requests a challenge-response md5 based authentication.
\nChallenge response protocol differs from password-based authentication protocol in that the first doesn't send the password itself instead of the server since a challenge to the client cannot be solved unless the client has the right password.
\nThe server sends the challenge in base 64 encoding, and the client sends their response for the challenge using the same encoding scheme.
\nSince the user supplied the right password, the server replies with an okay message telling the user that the authentication has been successful.
\nLater that client requests to view his mailbox including the inbox, junk box, trash, etc.
\n
Using the same methodology, we can filter for SMTP protocol tickets to see the emails that were sent during the capture. We need to replace the imap filter with an SMTP filter and view the TCP stream.
\n
The session also starts with the server sending its banner and its time to the client.
\nThe client replies for the better with the extended hello command.
\nThe server offers different operations for the client to choose from.
\nAs we saw earlier the client authenticate using its username and password and then it sends an email to user2 asking them to delay an appointment
", "flags": [], "min_points_to_pass": null, "access_type": "default", "user_status": "unstarted", "user_lab_status": null, "user_status_modified": null, "user_flags": [], "global_running_session": null }