Fancy commercial tools aren't always available for us to use when we want something out of a log file. Therefore, it is important to know how to write simple scripts to extract data and display it in a convenient format.
In this lab, you're presented with various log files from different services. You need to identify those files and extract fields from them.
Evidence can be found at Desktop/Module8/Lab25/. The evidence folder includes the following log files.
Different important Linux server log files.
Extracting certain pieces of information from a file.
Manipulate the output and format it in a custom way.
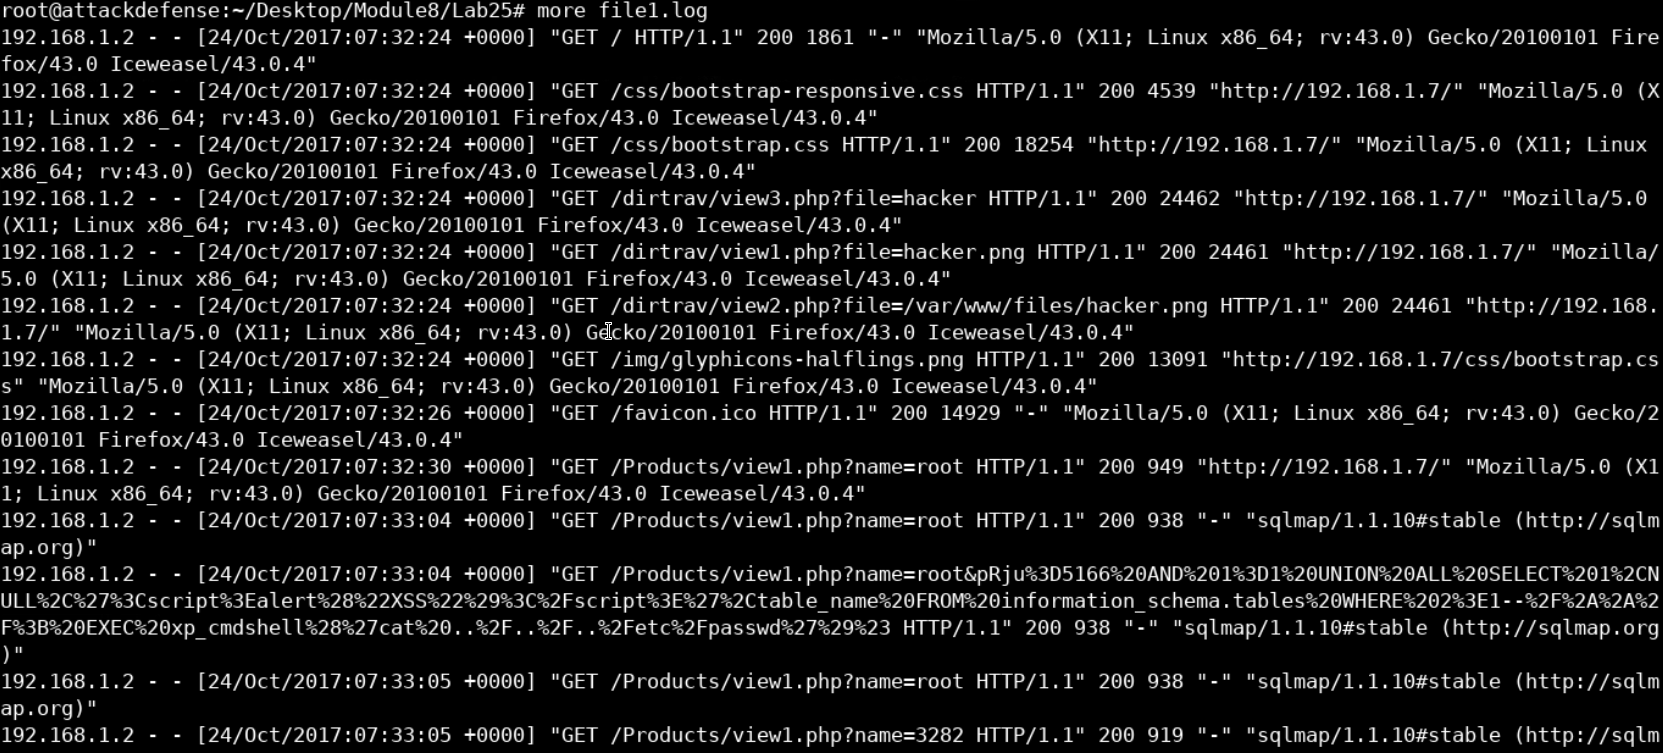
We're going to start by examining the log file using the Linux "more" command. More is usually a more efficient command to use than cat because it allows you to scroll down through the text file you are viewing. This is convenient especially when you're viewing a very large file such as log files.
more file1.log
The difference between cat and more is that cat displays the whole content of the terminal and exits.
That means that if you're working on a Linux distribution, you may not be able to scroll up to examine the start of the file. On the other hand, more displays part of the file and allows you to scroll down through it using the enter button.
From the GET / we can tell that this seems like a web server log file. The format and the fact that we didn't see the IIS banner at the beginning of the file suggests that this is probably an apache server.
The client IP address seems to be the first field in each record, followed by a timestamp when the request was submitted by the client and finally the browser's signature.
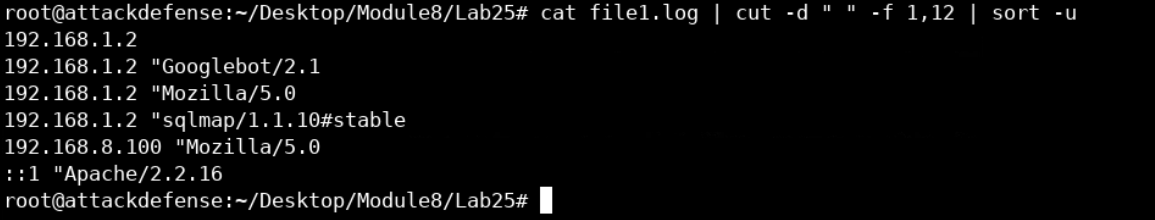
So, to solve this task, we need to display the first and last field of each record. We can do that by combining cat, cut and sort commands, as follows.
cat file1.log | cut -d " " -f 1,12 | sort -uThe previous command starts by using cat and redirecting the output to be the input for the cut command. We are using the cut command to cut each record using the space as a delimiter and to pick the 1st and the 12th fields up. Finally, we pipe the output to the sort command where we're asking it to display unique values only to avoid redundancy.
Since this is a web server log, it makes perfect sense to check for the most well-known web applications attacks when editing search logs.
Let's display the contents of the log file and grep for the keywords that we know as associated with web attacks:
cat file1.log | grep script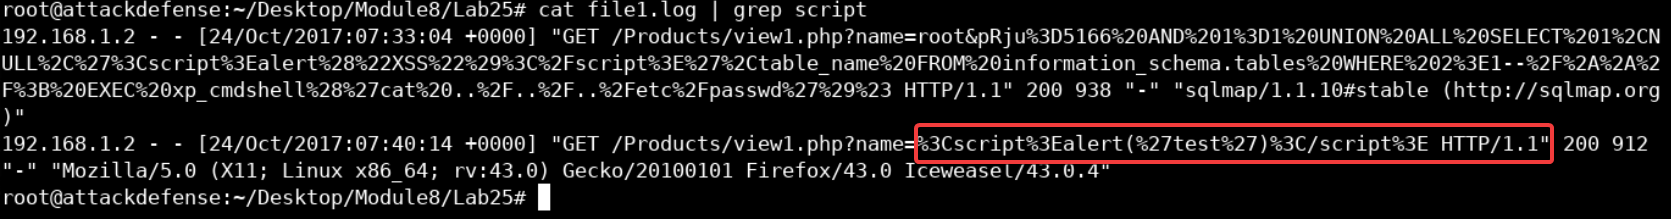
We can see the standard payload for the XSS attack appearing in multiple locations in the log file. The same happens when we grep for SQL injection-related keywords such as AND.
cat file1.log | grep AND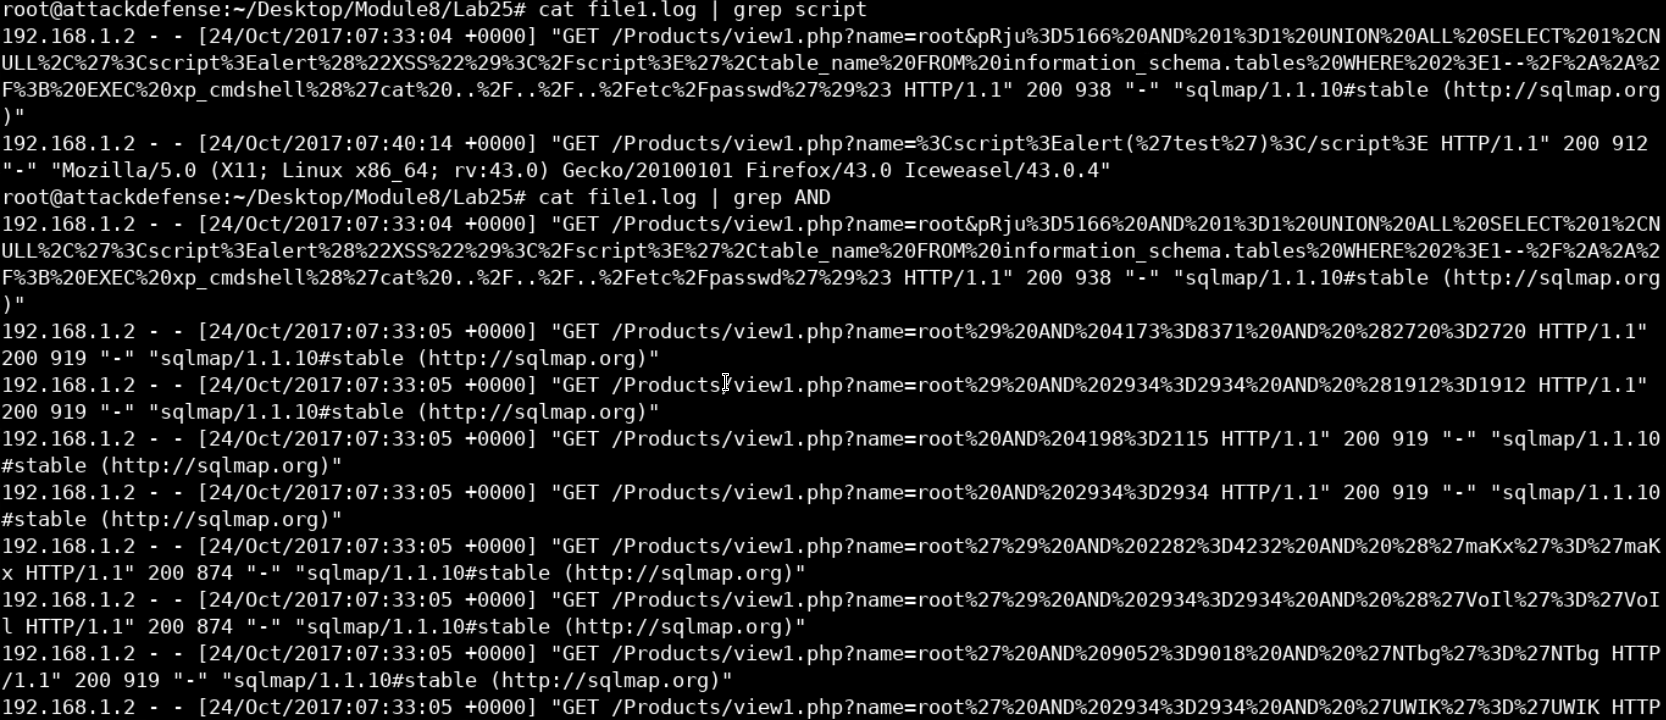
We can see based-64 encoded SQL queries appearing in various locations in our log file which suggests that the web application was being tested for SQL injection vulnerabilities using some automated tool.
If you are familiar with web penetration testing, you'll recognize the name SQLMAP which appears in our log. SQL map is an SQL injection testing tool used by penetration testers and hackers to test and exploit SQL injection vulnerabilities.
The fact that it adds a signature to every request it makes can help us track it in other log files.
Just like we did before we can do the same and examine the log file to try and determine its type.
cat file2.log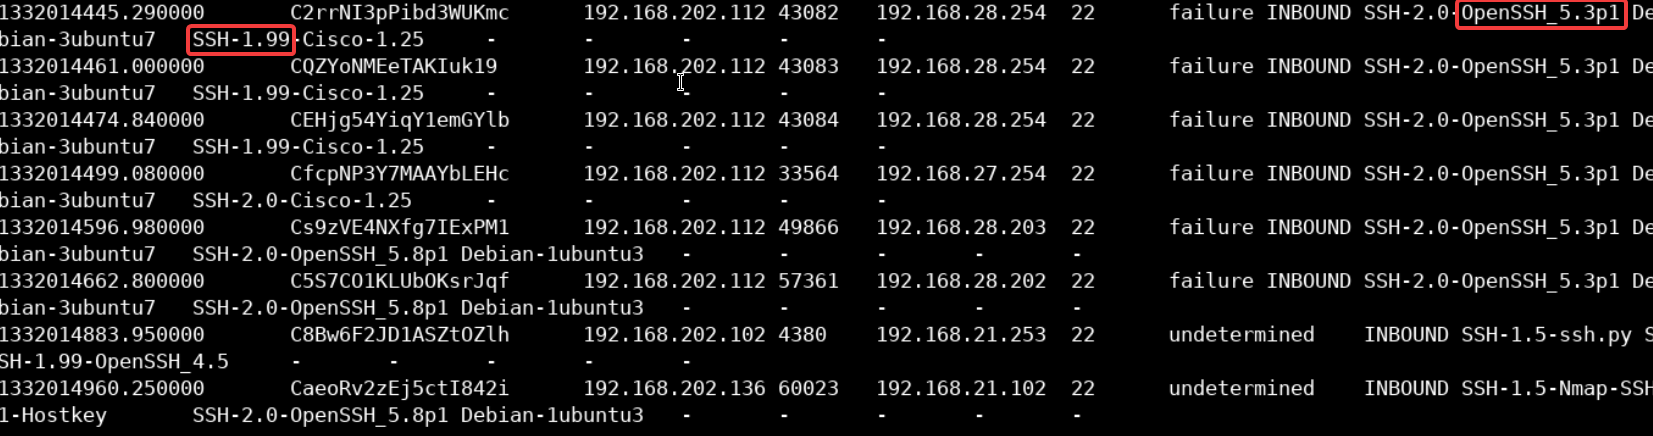
It is not hard to determine what type of service this log file belongs to as we can see the term SSH appearing in multiple locations in the file.
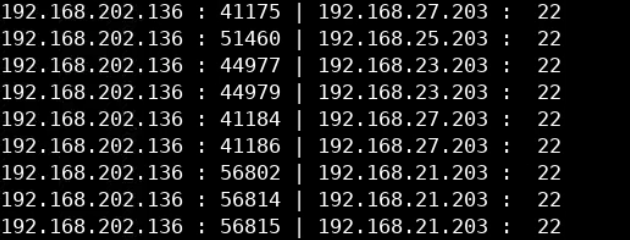
To filter the server-client IP addresses, we can use the following AWK script (inside the Desktop/Module8/Lab25/ directory.
awk -F "\t" '
BEGIN { printf "%-14s : %-3s | %8s : %8s\n","src_IP","src_port","dst_IP","dst_port" }
{ printf "%-10s : %3d | %10s : %3d\n", $3,$4,$5,$6} ' file2.log
Which will display the following output
Just as we did before, we can examine the file using a cat again.
cat file3.log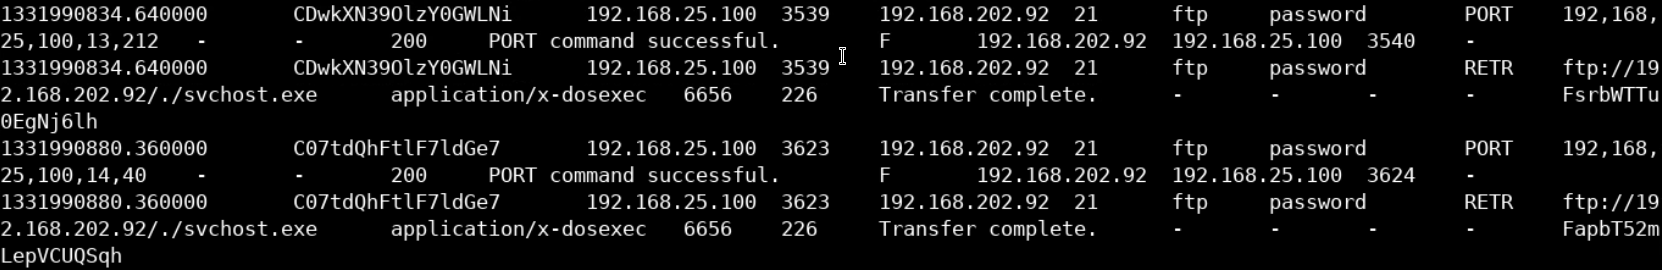
Even though the output may seem confusing at first, we can see that this is an FTP log file.
We can tell that from the used commands, ports and addresses.
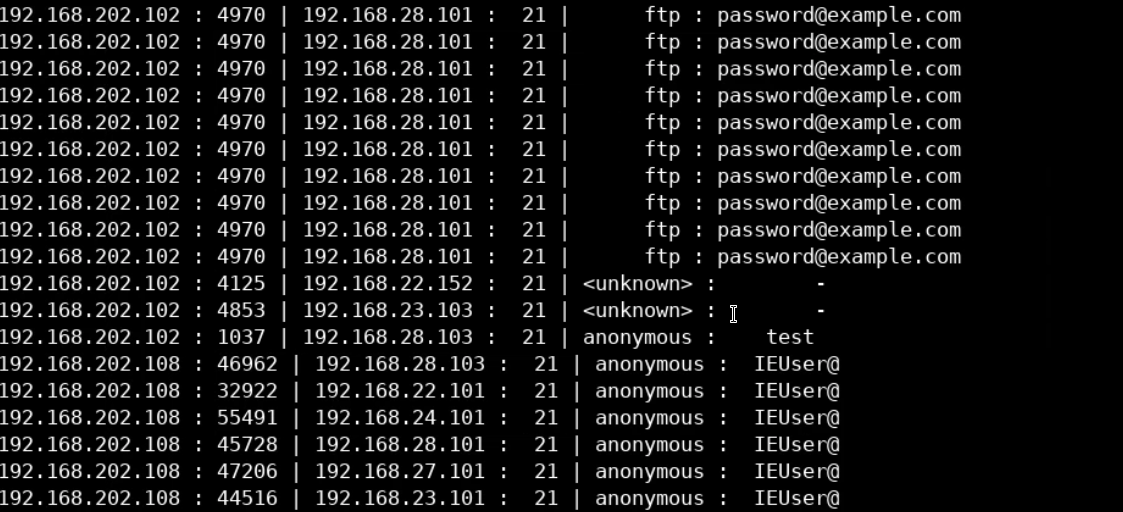
To analyze the file, we can create a similar script to the one we used before.
awk -F "\t" '
BEGIN { printf "%-14s : %-3s | %8s : %8s | %8s : %8s\n","src_IP","src_port","dst_IP","dst_port","user","pass" }
{ printf "%-10s : %3d | %10s : %3d | %8s : %8s\n", $3,$4,$5,$6,$7,$8} ' file3.log
After running the script, we get a list of IPs, ports, and credentials that were used.