The organization you work for is considering to deploy Suricata to enhance its traffic inspection capabilities. The IT Security manager tasked you with thoroughly analyzing Suricata's capabilities.
A test instance of Suricata has already been set up and is waiting for you!
The learning objective of this lab is to get familiar with the detection capabilities and features of Suricata.
Specifically, you will learn how to leverage Suricata's capabilities in order to:
Have better visibility over a network
Respond to incidents timely and effectively
Proactively hunt for threats
Suricata is a high-performance Network IDS, IPS, and Network Security Monitoring engine. It is open source and owned (as well as developed) by a community-run non-profit foundation, the Open Information Security Foundation (OISF).
Suricata inspects all traffic on a link for malicious activity and can extensively log all flows seen on the wire, producing high-level situational awareness and detailed application layer transaction records. It needs specific rules (holding instructions) to tell it not only how to inspect the traffic it looks at but also what to look for. Suricata was designed to perform at very high speeds on commodity and purpose-built hardware.
The most important Suricata features and capabilities are:
Deep packet inspection
Packet capture logging
Intrusion Detection
Intrusion Prevention
IDPS Hybrid Mode
Network Security Monitoring
Anomaly Detection
Lua scripting (You can use the Lua programming language to write custom scripts that will be executed when a particular rule or signature triggers an alert)
Rust (Allows Suricata to fail in a safe mode)
GeoIP
Multitenancy
File Extraction (from protocols like SMTP, HTTP, etc.)
Full IPv6 and IPv4 support
IP Reputation
JSON logging output
Advanced protocol inspection
Multi-threading
Suricata has four operation modes:
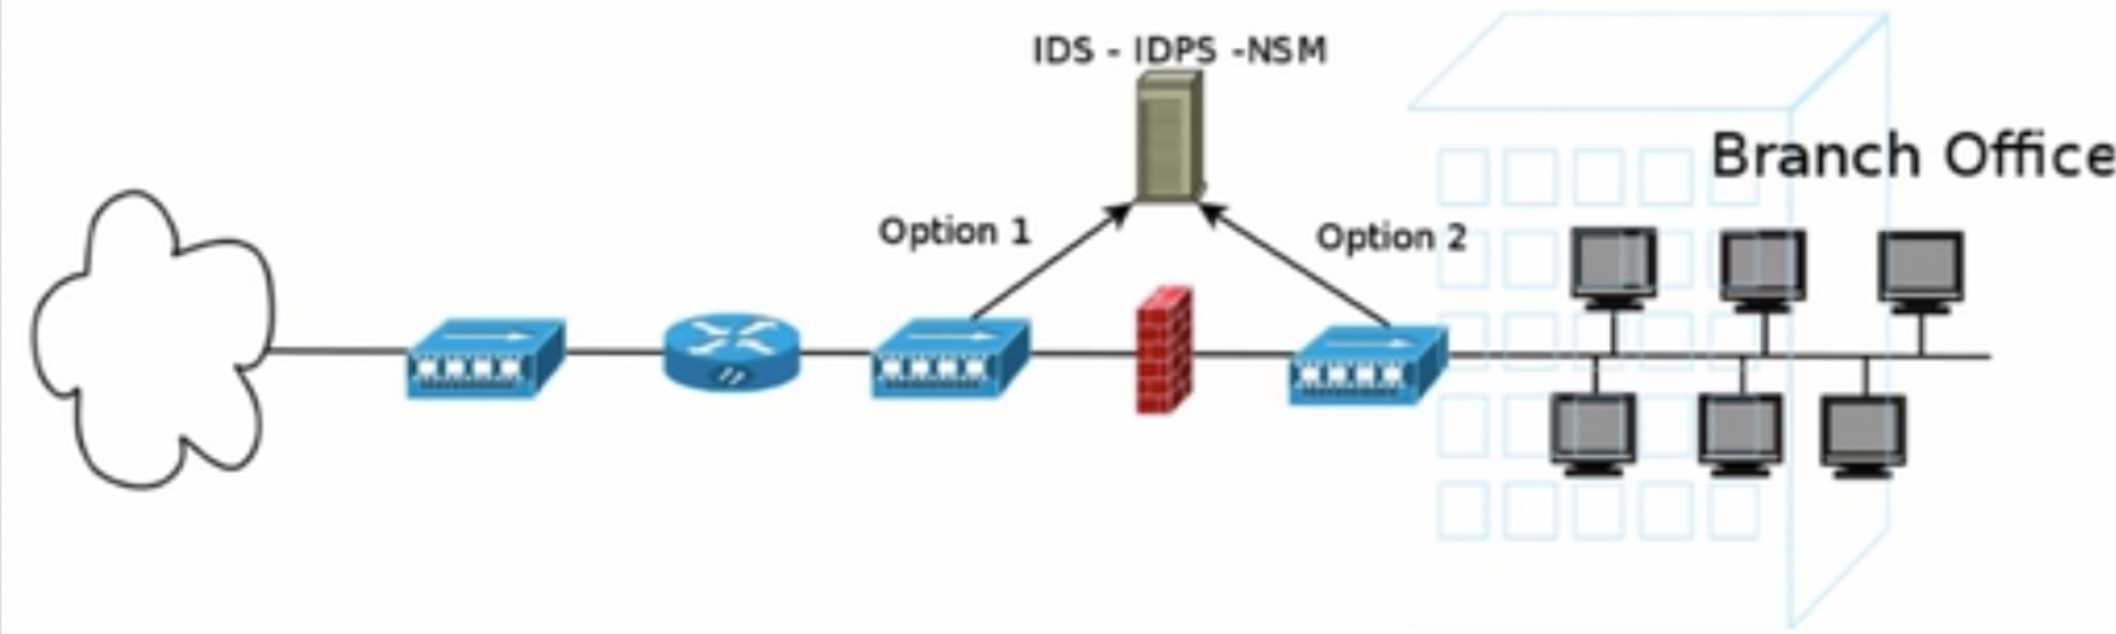
Passive in terms of prevention and impact on information systems, Suricata passively listens and inspects the traffic to detect attacks when deployed as an IDS. It doesn't offer any kind of protection, just increased visibility and reduction in response time.
A process should be implemented to monitor, handle and act upon the generated alerts, logs and data.
Intrusion Prevention System (IPS) [Active way of preventing threats]
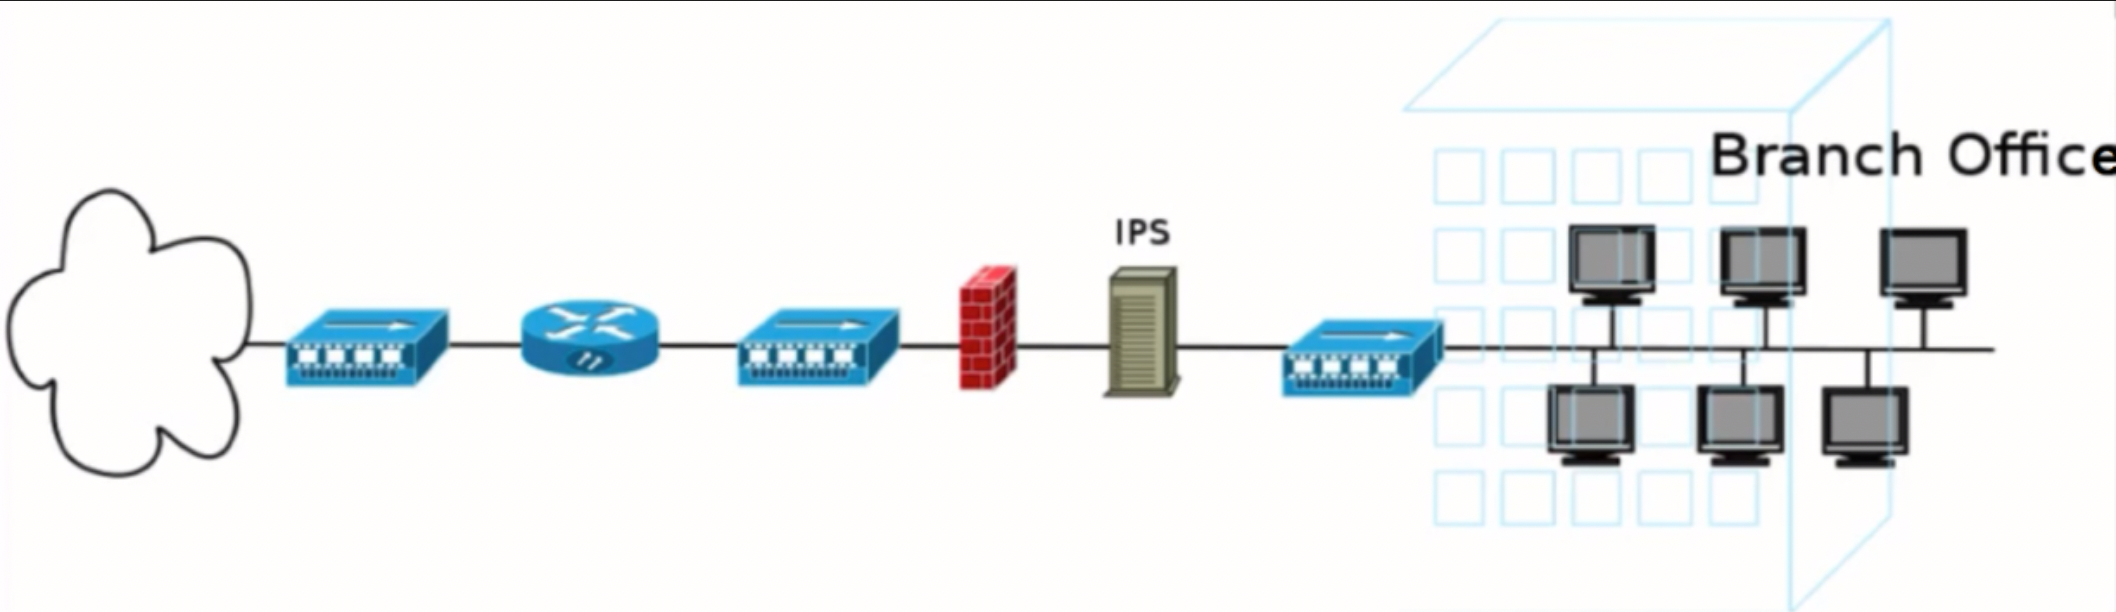
Active in terms of prevention and impact on information systems, traffic passes through Suricata and will reach the internal network only if Suricata allows it to do so; this means that Suricata can prevent/block attacks before they reach the intranet when deployed as an IPS.
Suricata's deployment and setup as an IPS are demanding, not only because an understanding of the whole intranet is required beforehand (so that legitimate traffic is not blocked/dropped) but also because the rules to be enabled require a lot of testing and verification.
Note that traffic needs to be inspected first and that will add latency.
Intrusion Detection Prevention System [IDPS] [Hybrid between the first two]
A hybrid mode where Suricata is deployed as an IDS (it passively listens to traffic via a port mirror or something similar), but it actually does have the capability to send RST packets, if it notices that something is not right.
Having low latency is of great importance in this case since Suricata packets need to reach out to targets first. In this mode, it offers limited active protection.
Network Security Monitoring (NSM) [No traffic inspection, only logging]
Suricata will not perform any active or passive inspection of traffic, and it will not prevent any kind of attack. It will just listen and log everything it sees. HTTP requests and responses, SMTP interactions, TLS, SSH, DNS, NFS traffic, etc. will be logged.
This kind of deployment produces vast amounts of data, but this level of verbosity will be useful during an investigation.
Suricata is typically used as an IDS and for offline PCAP analysis (unix-socket-mode)
Suricata Inputs
Offline Input (Essentially reading PCAP files)
PCAP file input allows for the processing of previously captured packets in the LibPCAP file format. This type of input is useful not only for offline analysis of previously captured data but for experimenting with various configurations and rules as well.
Live Input
LibPCAP can also be used for live packet analysis. LibPCAP works on all platforms and supports most link types. On the other hand, there is no load balancing limiting the input of packets to a single thread and performance is not so great either.
Inline (If the hardware is appropriately set up, Suricata can not only read packets but also drop packets for prevention purposes) [Active IPS mode]
NFQ is an inline IPS mode for Linux that works with IPTables to send packets from kernel space into Suricata for inspection. It is often used inline, and it requires the use of IPTables to redirect packets to the NFQUEUE target which allows Suricata to inspect the traffic. Drop rules will be required in order for Suricata to drop packets.
AF_PACKET is the recommended input on Linux. It offers better performance than LibPCAP. In addition to IDS mode, AF_PACKET can also be used in IPS mode (inline) by creating an Ethernet bridge between two interfaces (copying packets between those two interfaces, processed by Suricata along the way). AF_PACKET cannot be used inline if the machine must also route packets (such as a Linux machine performing Network Address Translation). It supports multiple threads. The only con is that it is not available in older Linux distributions.
Note that other (less popular or more advanced) inputs also exist.
Suricata Outputs
Notes:
Below, you can find solutions for every task of this lab. Remember though, that you can follow your own strategy (which may be different from the one explained in the following lab.
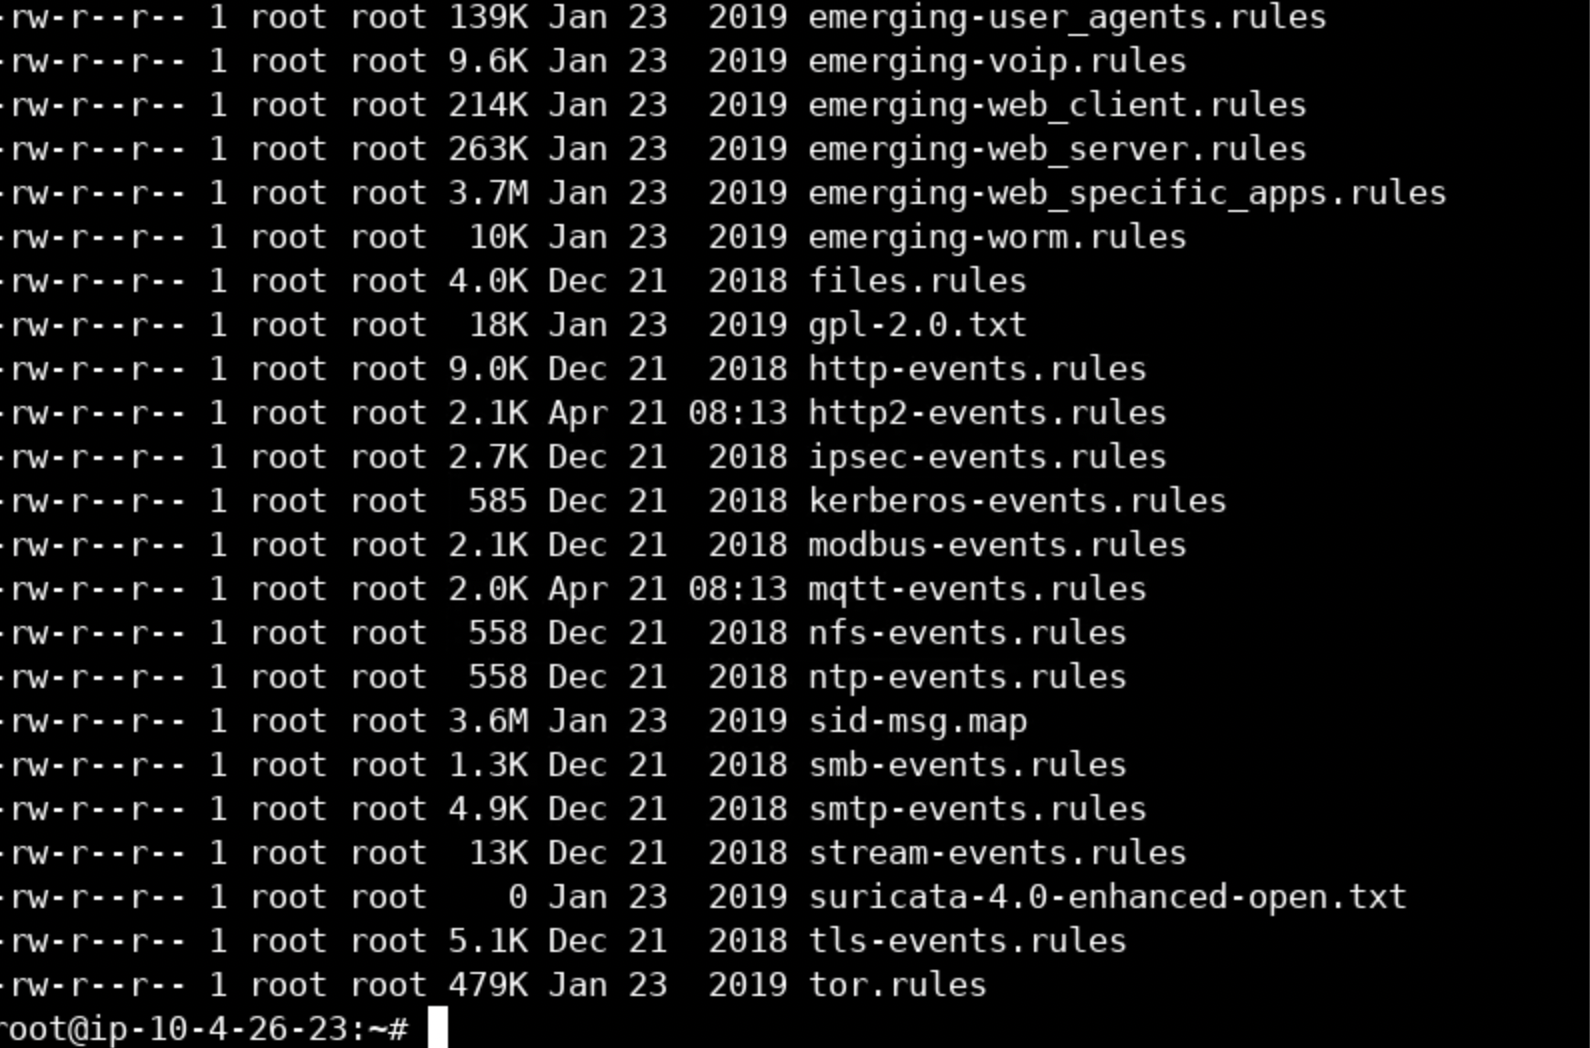
You can list all Suricata rule files by executing the below.
ls -lah /etc/suricata/rules/You should see something similar to the following.
To see how a rule file looks, execute the below.
more /etc/suricata/rules/emerging-trojan.rulesYou should see something similar to the following.
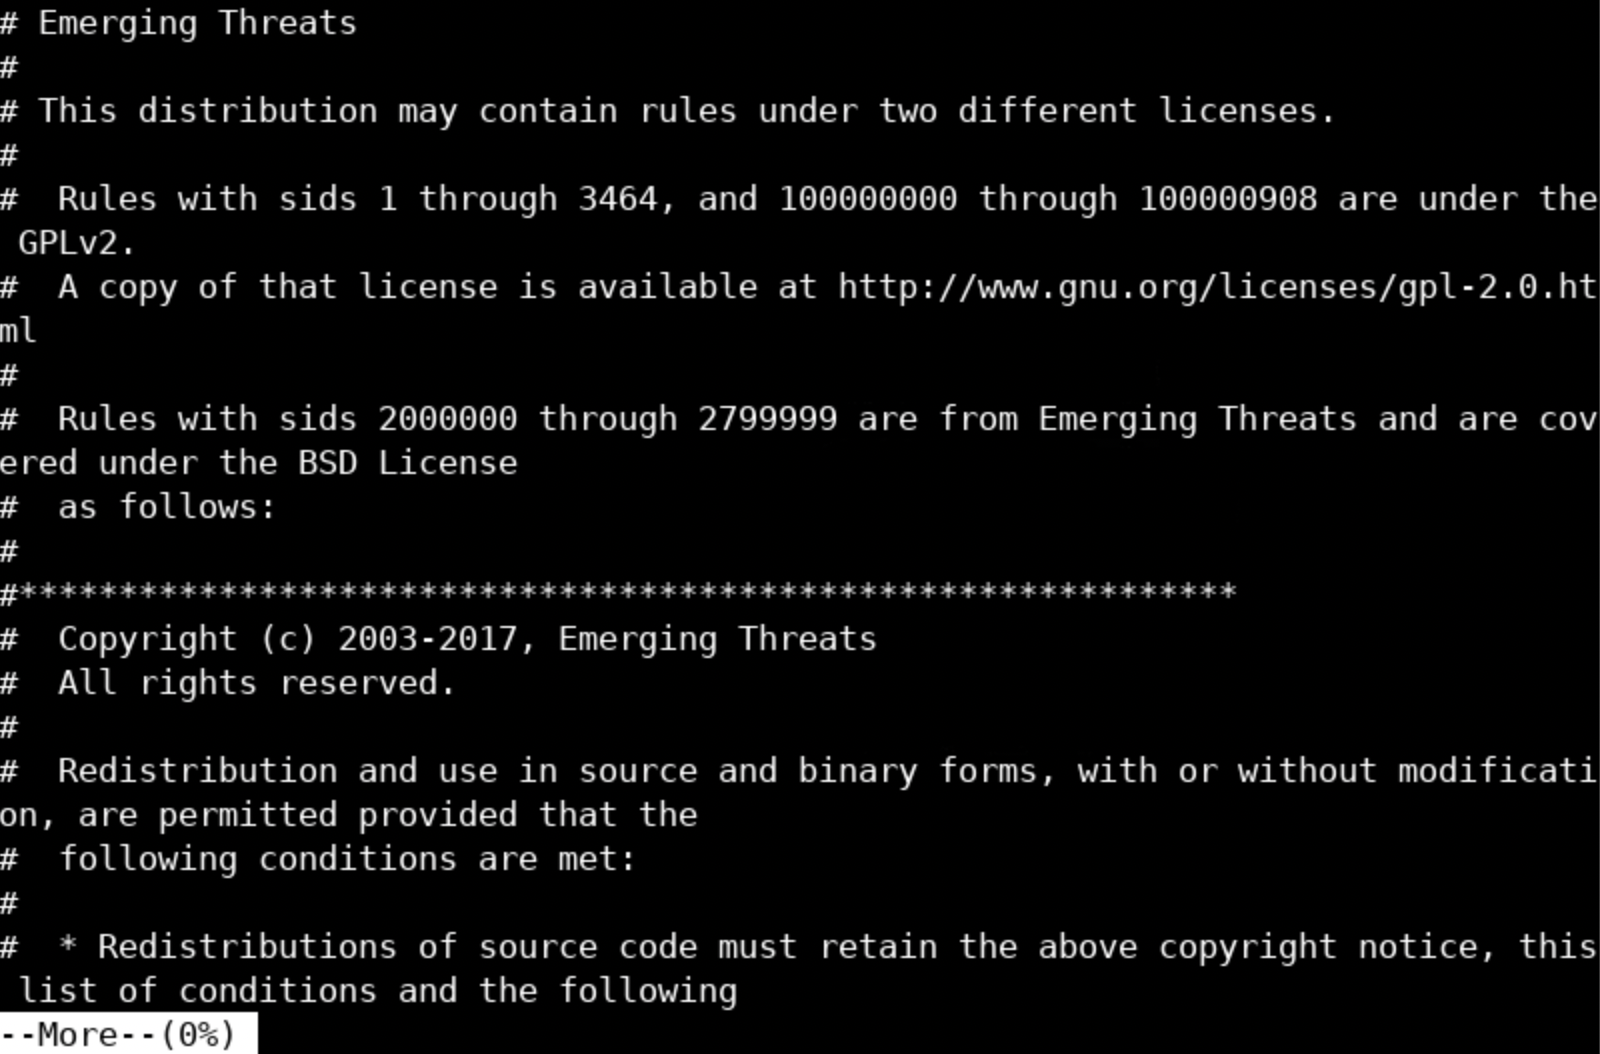
Press the Space key multiple times, and you will be presented with something similar to the below.
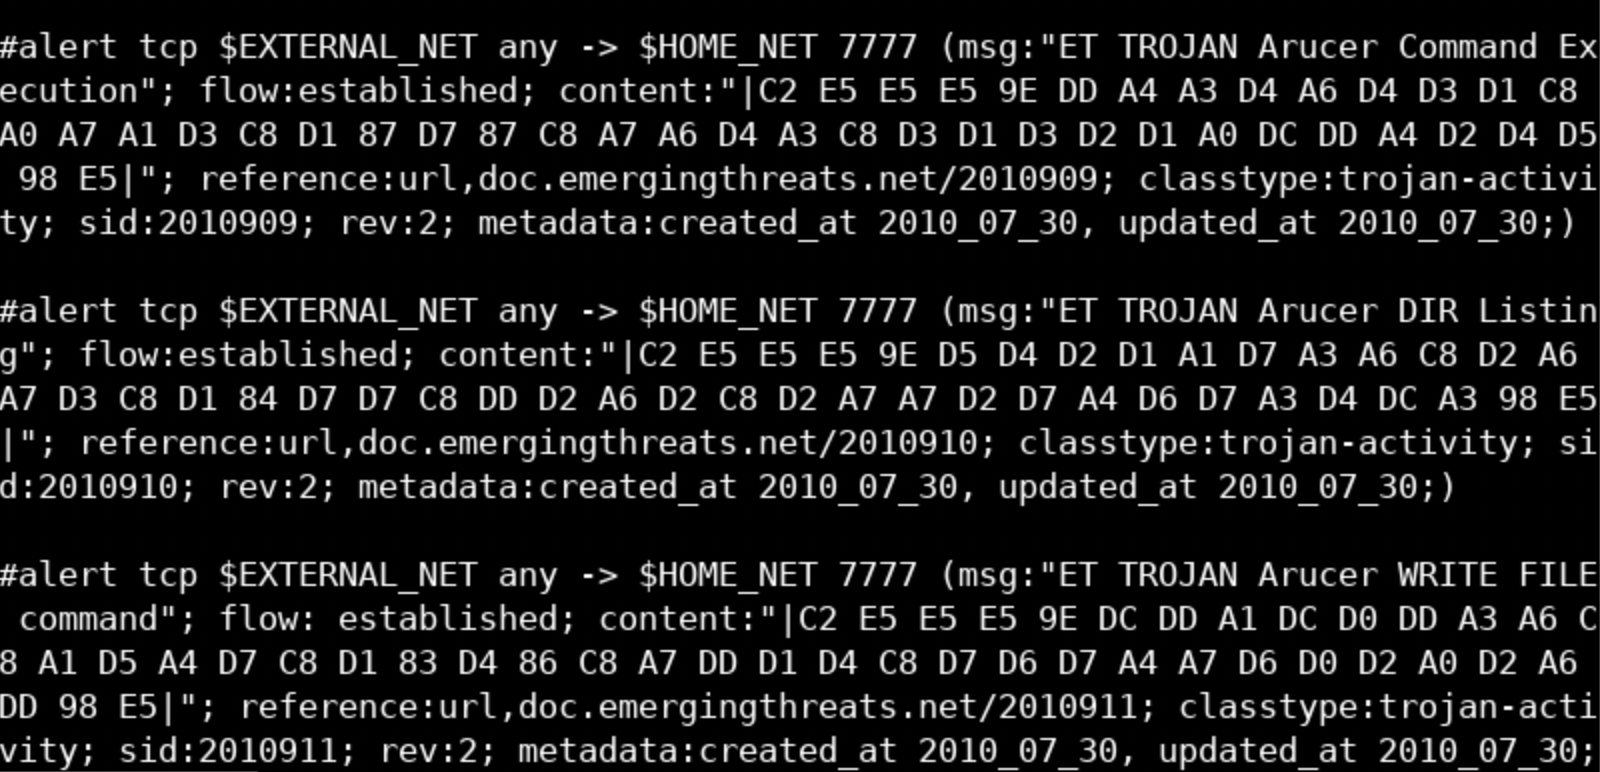
The first rule above is commented out; this means that it won't be loaded. This could happen if a new version of this rule has surfaced or if the threat related to this rule has become obsolete etc.
If you carefully look at the next rule, you will notice certain variables such as $HOME_NET and $EXTERNAL_NET. This rule will look for traffic from the IPs specified in the $HOME_NET variable towards IPs specified in the $EXTERNAL_NET variable.
These variables are defined inside the suricata.yaml configuration file.
more /etc/suricata/suricata.yaml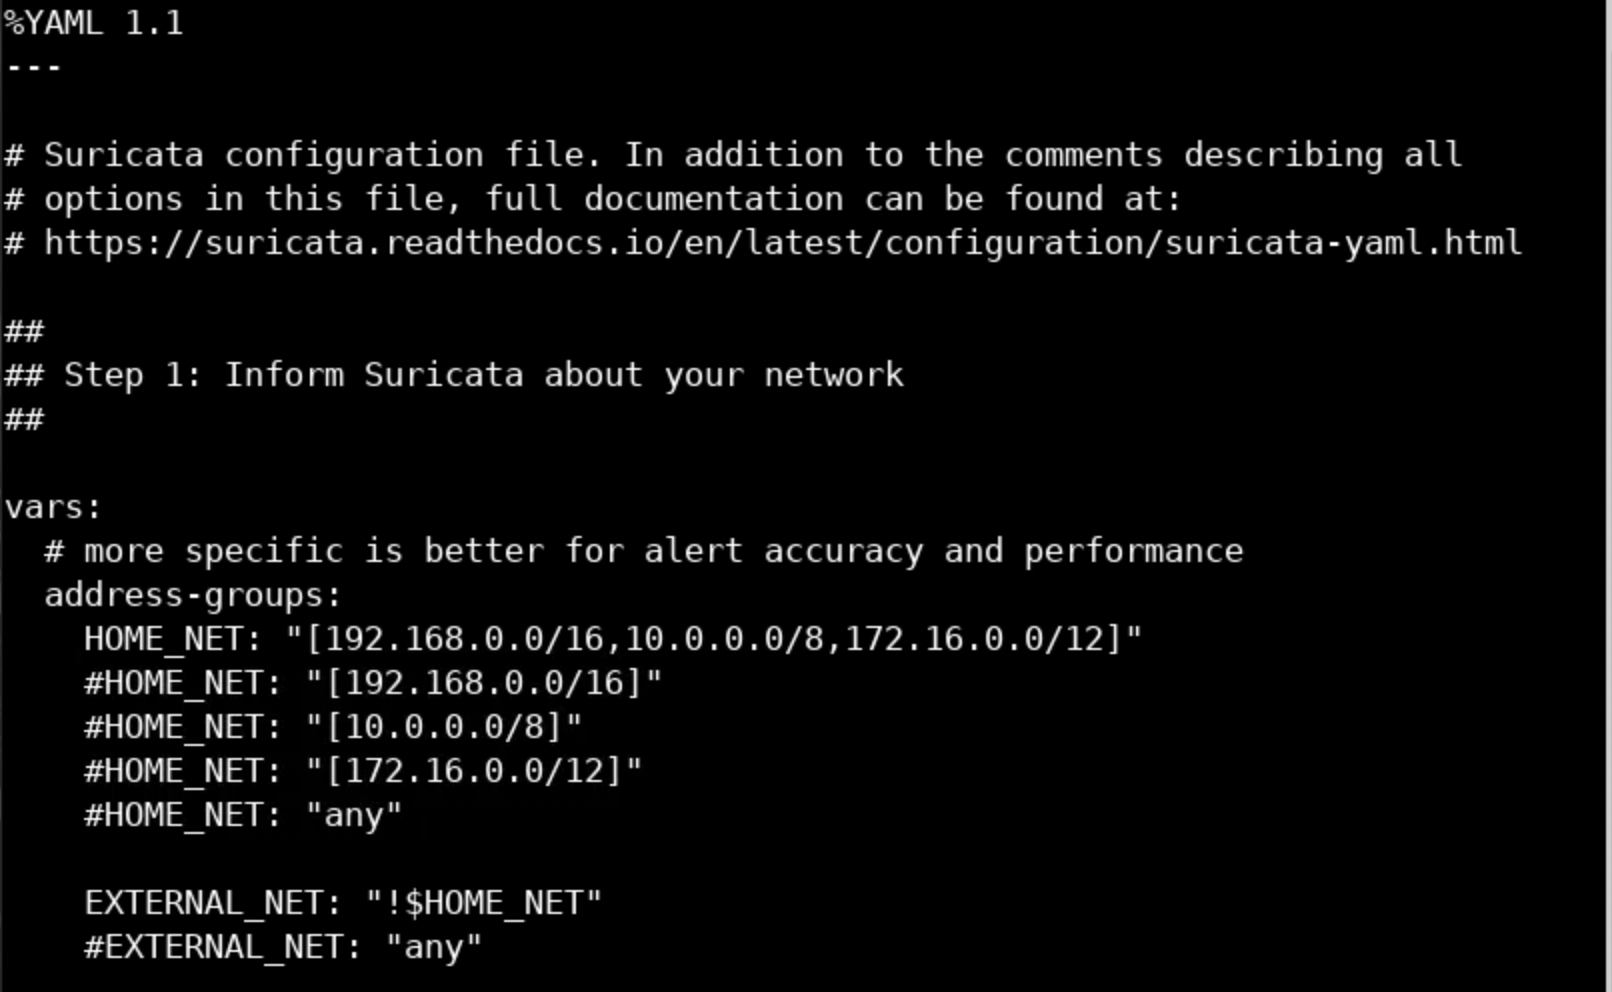
You can configure those variables according to your environment, after Suricata is installed, and even define your own variables. Inspect the whole configuration file in order to get familiar with it!
Notes:
Suricata performs automatic protocol detection. The *_PORTS variables are needed for compliance rules (for example, to verify that http traffic happens only on port 80). If you would like to check and alert specifically for "non-compliance/anomaly" traffic you could use some ideas from the below https://redmine.openinfosecfoundation.org/projects/suricata/wiki/Protocol_Anomalies_Detection
In case Suricata is sniffing between clients and a proxy, the proxy's address should be part of EXTERNAL_NET for malicious traffic between clients and the Internet to be detected. You can also enable XFF inside suricata.yaml to get more info.
Now, if you wanted to configure Suricata to load signatures from the customsig.rules file residing in the /home/elsanalyst directory, you should execute the following.
vim /etc/suricata/suricata.yaml
Enter /rule-path and press the Enter key
Press Shift + i
Change default-rule-path: from /etc/suricata/rules to /root/Desktop
Change rule-files: from - emerging-malware.rules to - customsig.rules
Press the Esc key
Enter :wq and then, press the Enter keyTo try Suricata with offline input, execute the following.
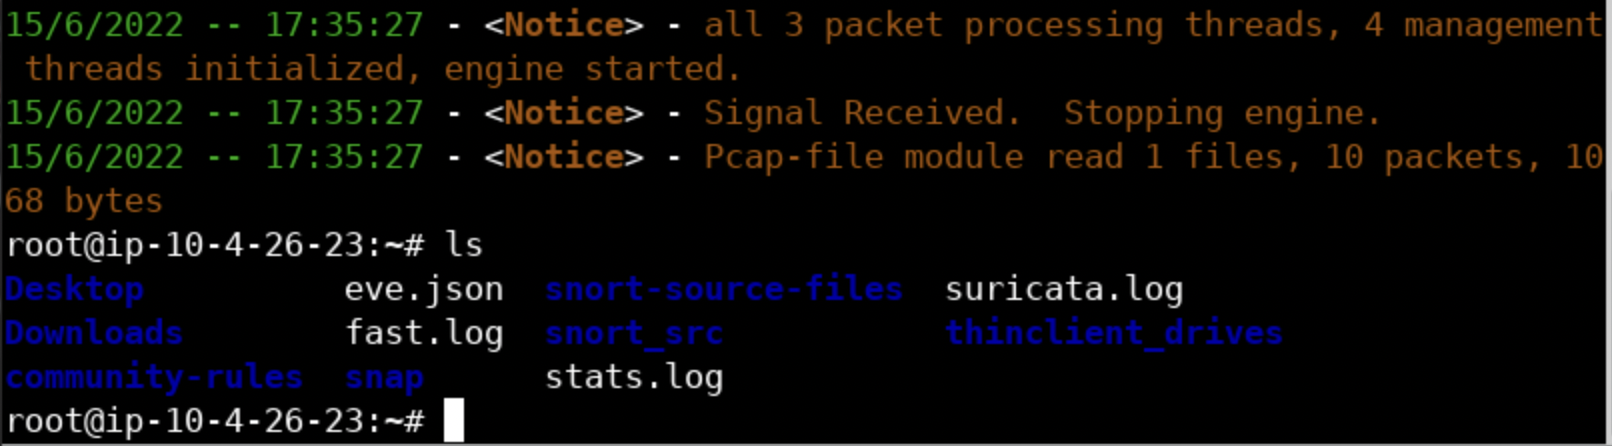
suricata -r /root/Desktop/PCAPs/eicar-com.pcapYou should see the following.
Suricata will create various logs (eve.json, fast.log, and stats.log) inside the /var/log/Suricata directory.
Alternatively, you can execute the following to not check checksums (-k) and to log in a different directory (the current one in this case).
suricata -r /root/Desktop/PCAPs/eicar-com.pcap -k none -l .You should see the below.
a. To try Suricata's (Live) LibPCAP mode, execute the following.
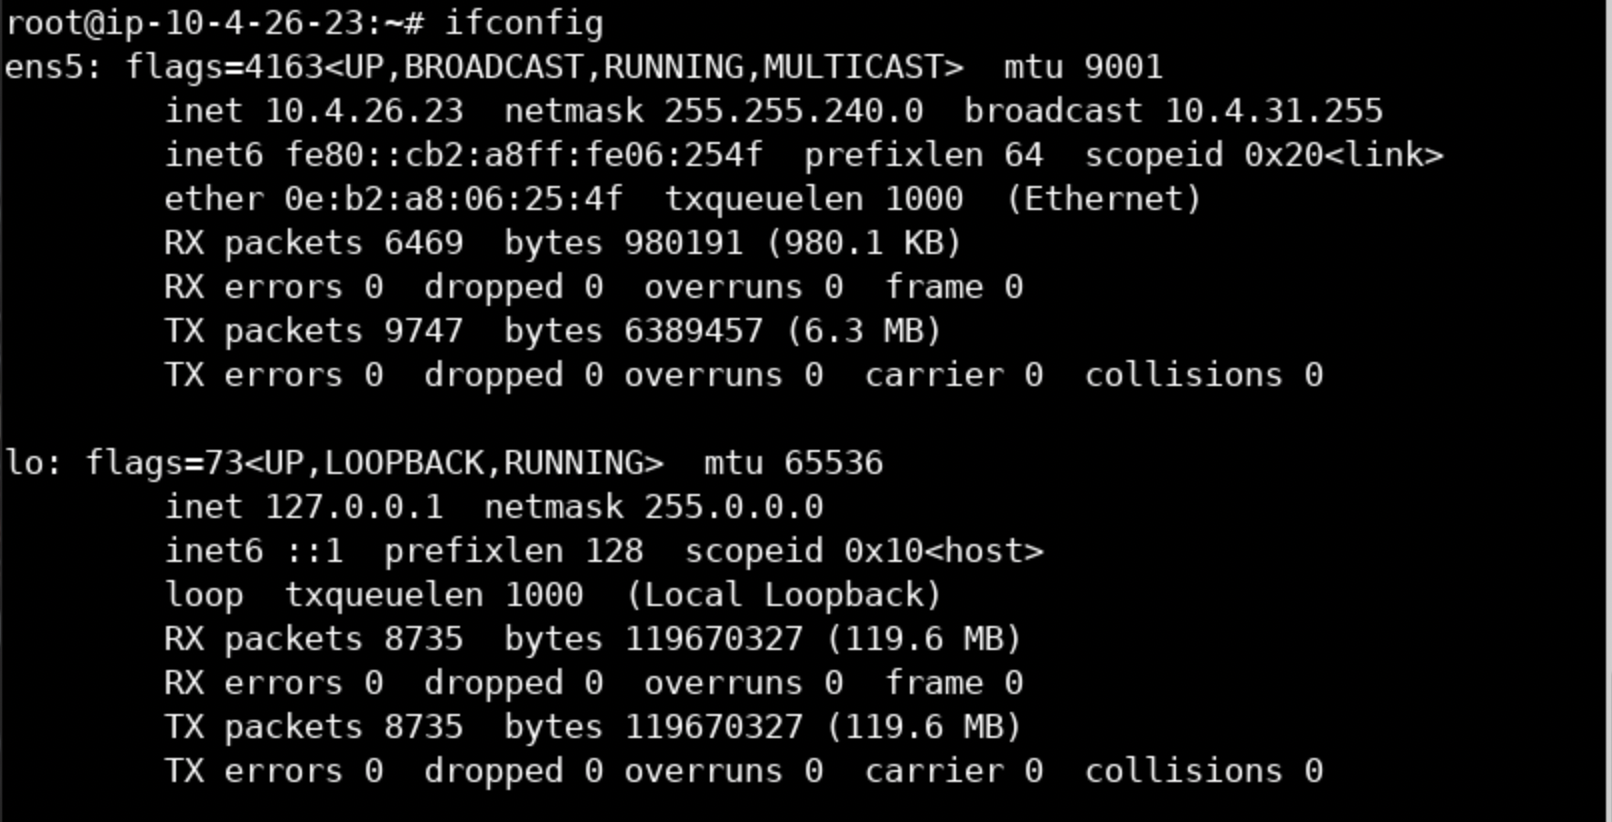
ifconfig <- To identify the network interface Suricata will listen on.
suricata --pcap=ens5 -vv
You should see interface you working with after ifconfig.
Output after --pcap command will be
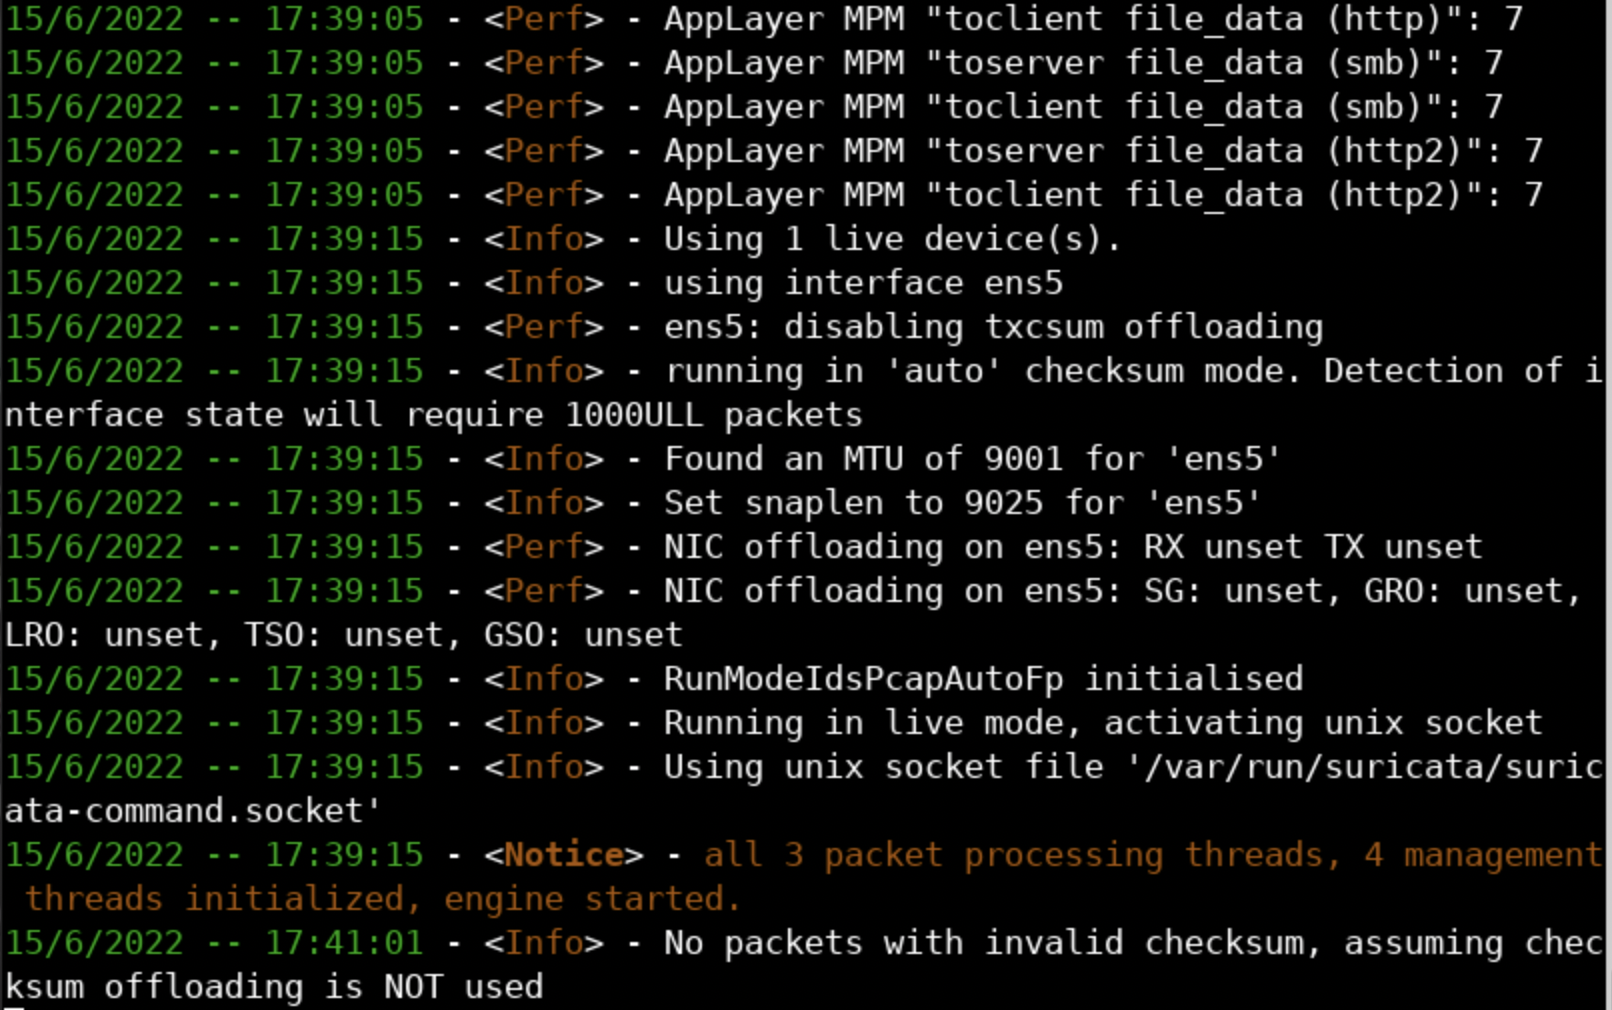
Alternatively, you can execute the following.
ifconfig
suricata -i ens5 -vv
Try it; scroll down and you will see the following.
The -i option of Suricata chooses the best input option (for Linux the best input option is AF_PACKET). If you need pcap mode, it is better to use the --pcap option.
(Live) LibPCAP can be configured via the suricata.yaml file. The available configurations include buffer size, BPF or tcpdump filters, checksum validation, threads, promiscuous mode, snap length, etc.
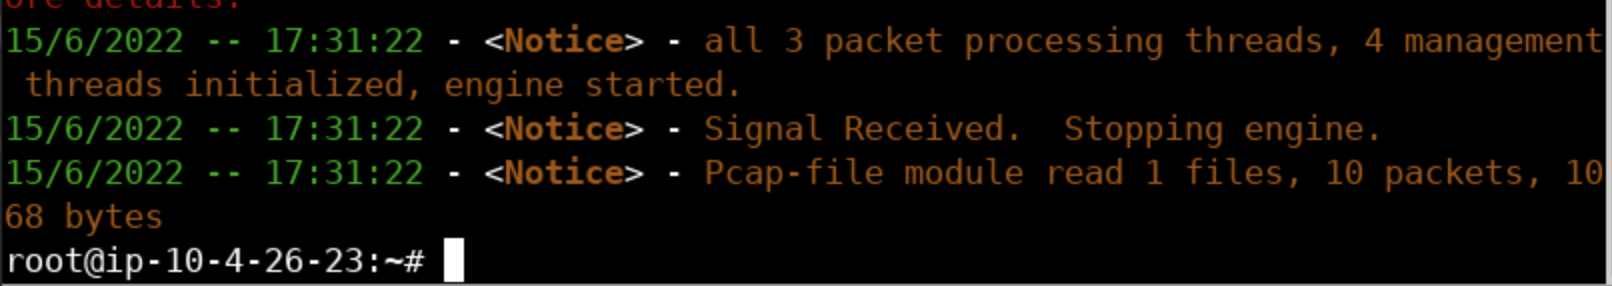
b. To try Suricata in Inline (NFQ) mode, execute the following (a security engineer should have executed iptables -I FORWARD -j NFQUEUE first).
suricata -q 0You should see something similar to the below.

Extra (not-related exclusively with 1 or 2 above)
To try Suricata in IDS mode with AF_PACKET input, execute the following.
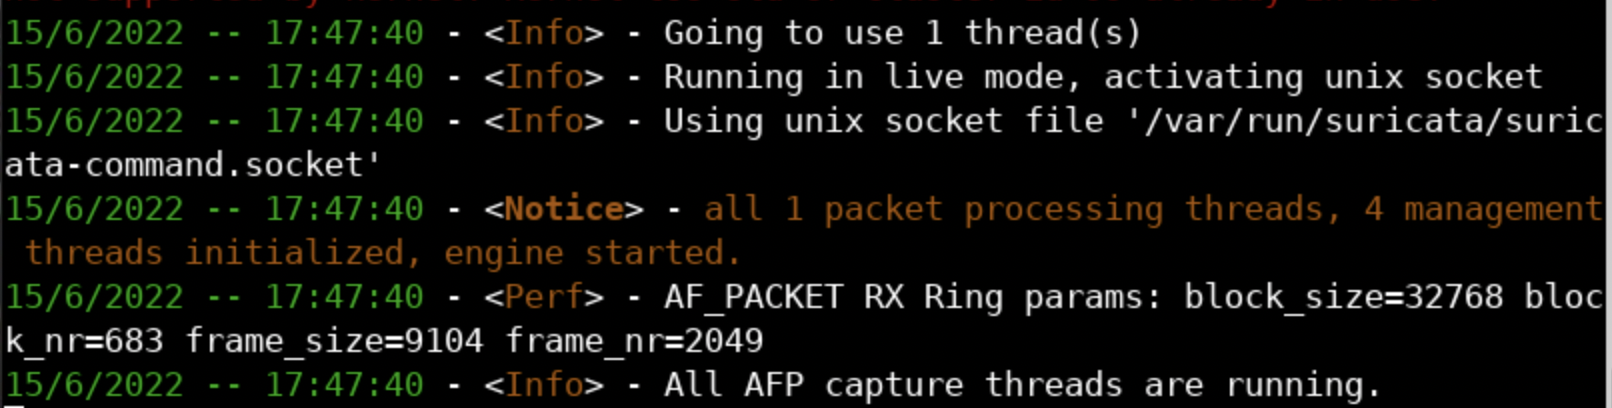
suricata -i ens5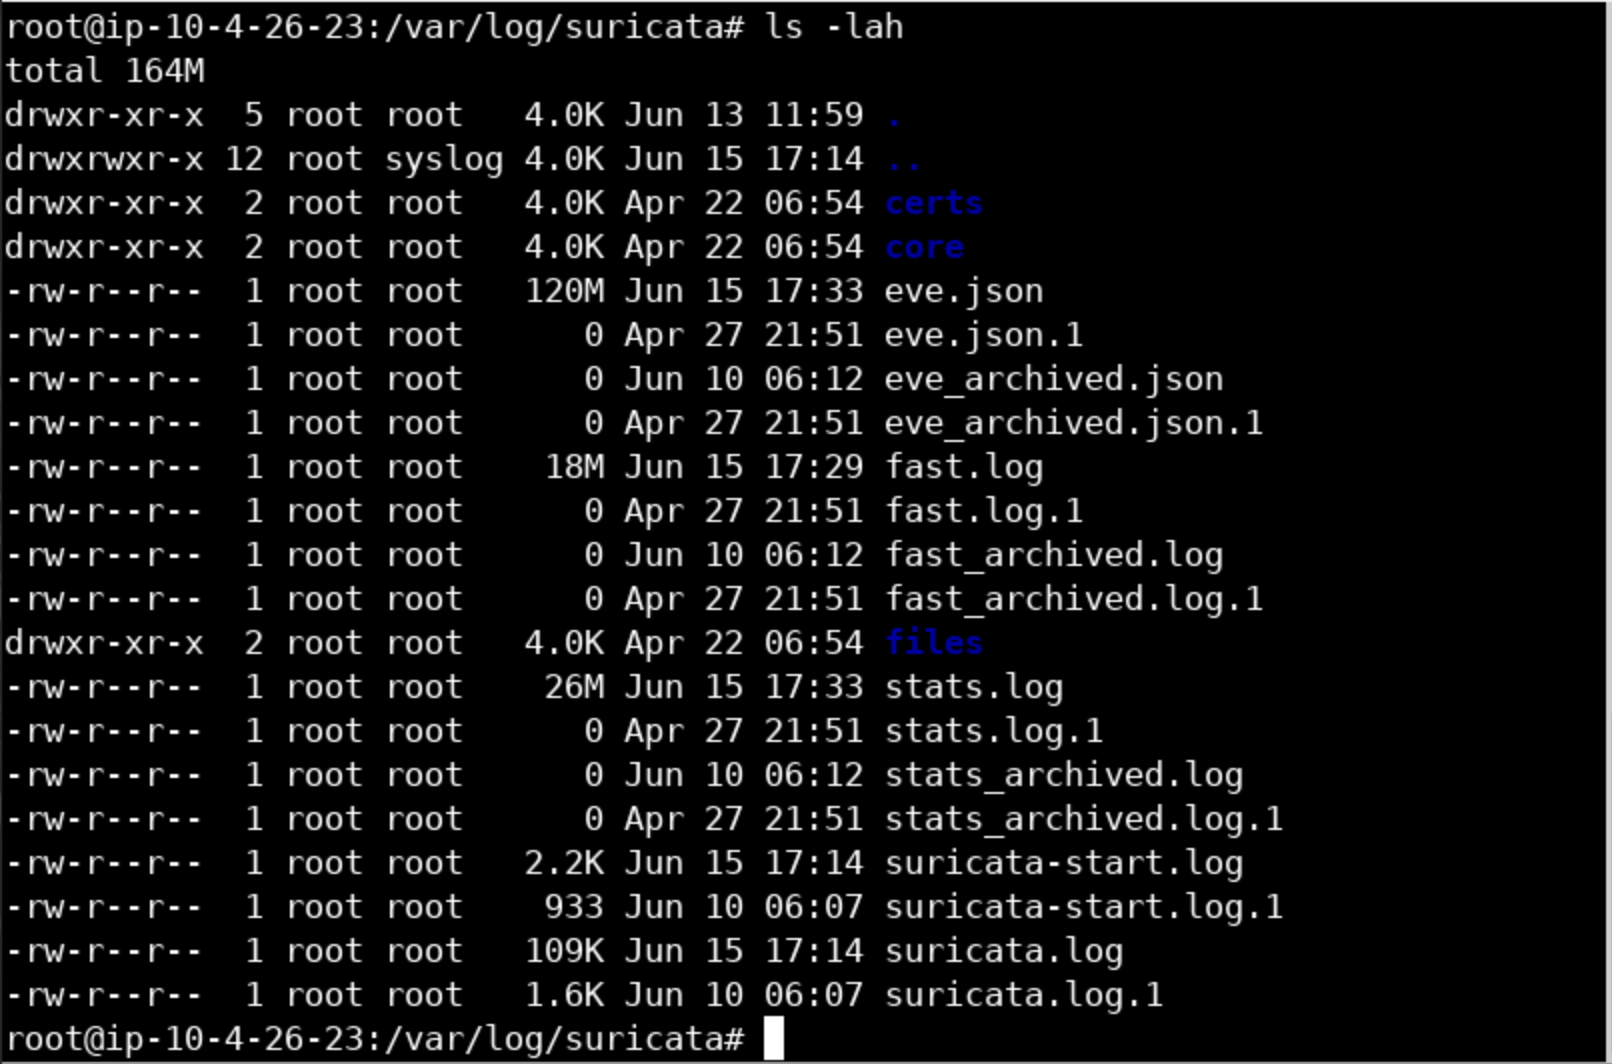
suricata -af-packet=ens5As already mentioned, Suricata outputs various logs inside the /var/log/suricata directory, by default. You need root-level access to edit or use them.
eve.json <- Suricata's recommended output
fast.log
stats.log <- Human-readable statistics log
eve.json
Inside the /var/log/suricata directory, you will find a file named eve.json.
You can start inspecting it, by executing the following.
cd /var/log/suricata
less eve.json
or
cd /var/log/suricata
less eve.json.1
You should see something similar to the below.
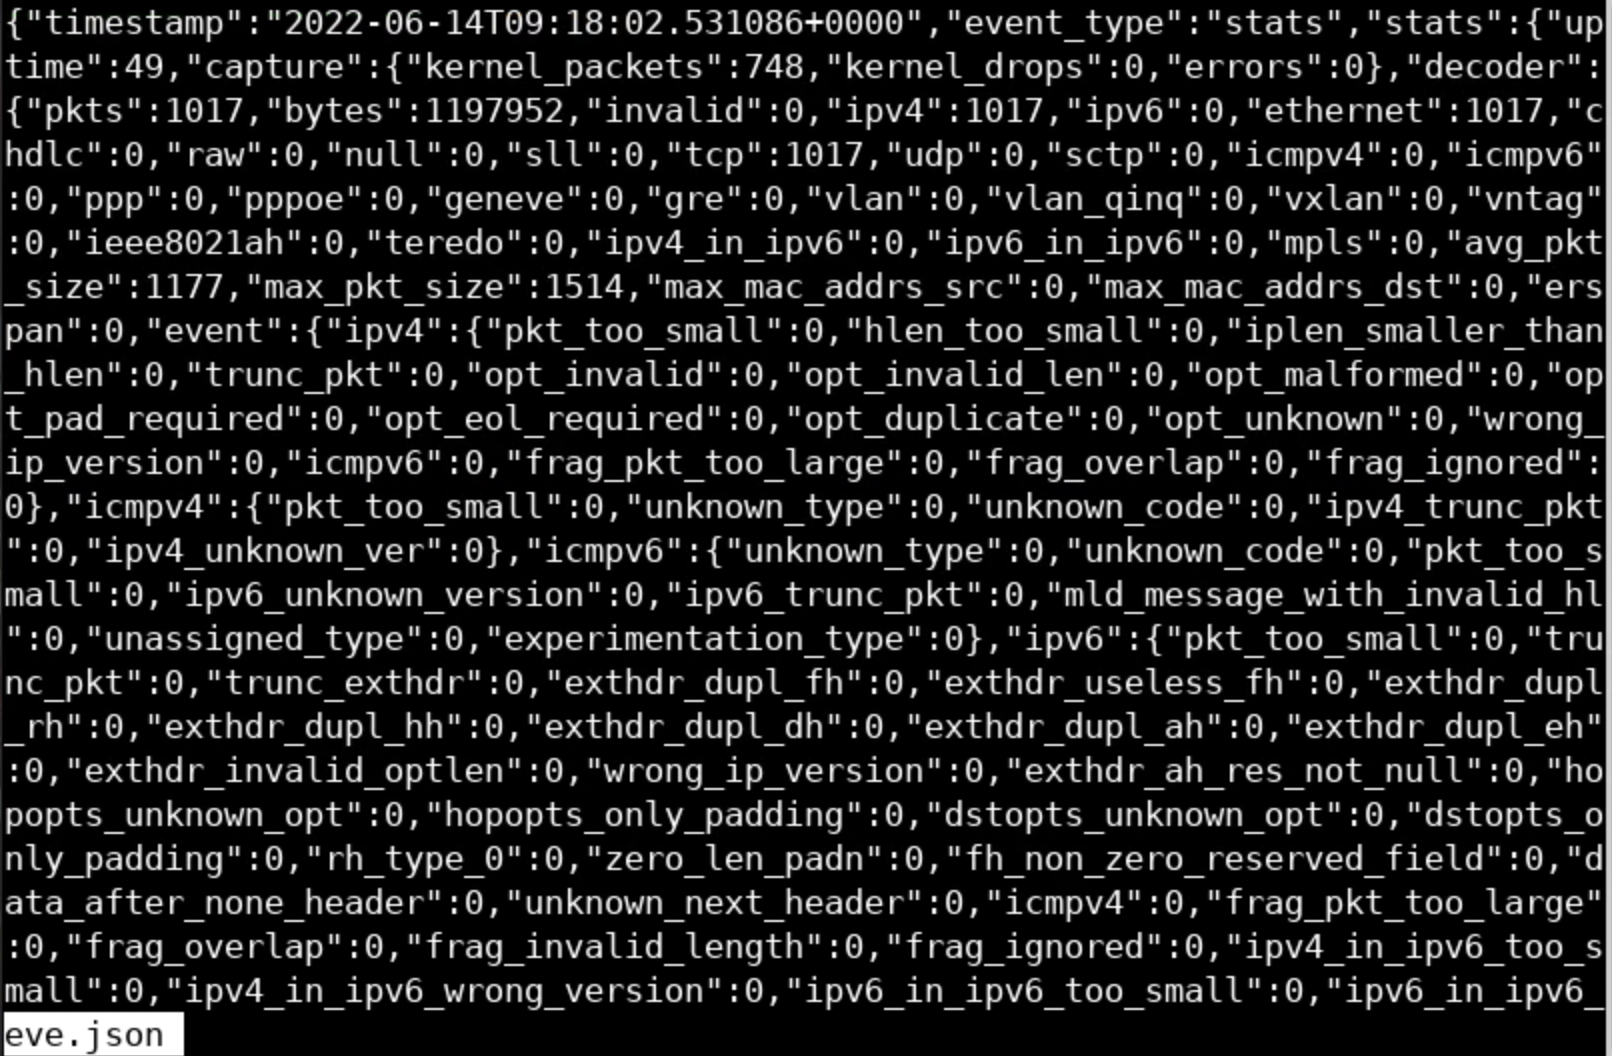
eve.json obviously contains JSON objects. These JSON objects contain information such as a timestamp, flow_id, event_type, etc. For example, the first entry has an event type of DNS and contains information about a DNS query.
If one wanted to filter out only alert events, he/she could use the jq command-line JSON processor, as follows.
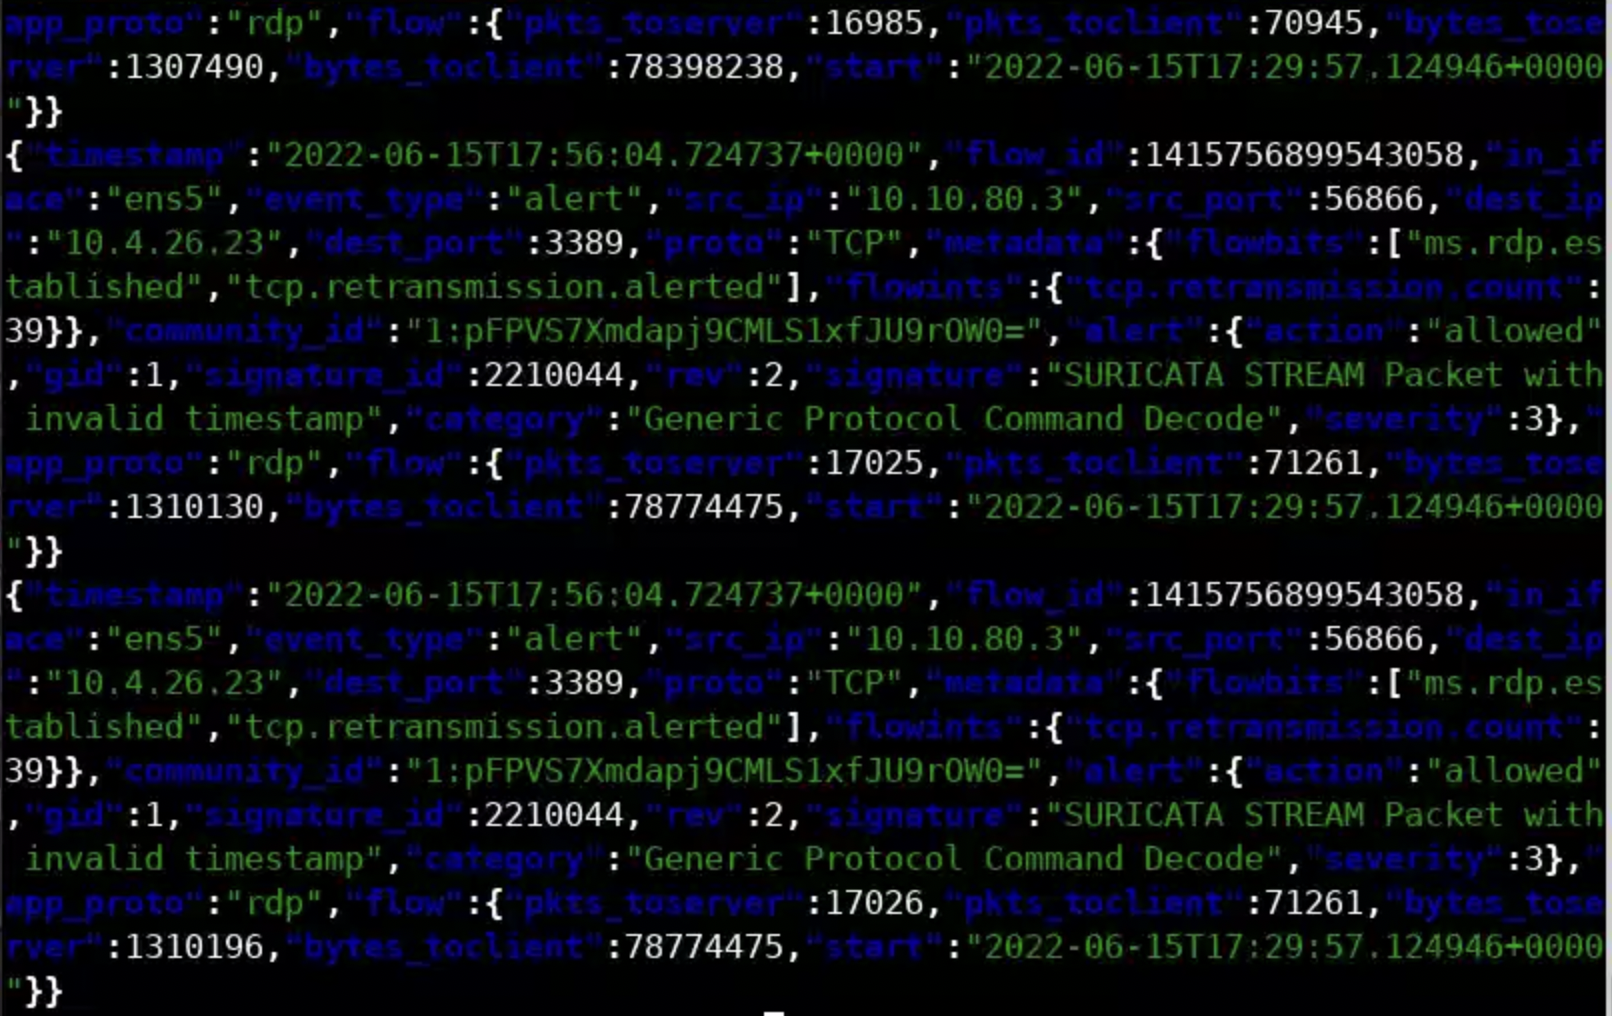
cat eve.json | jq -c 'select(.event_type == "alert")'If you do so, you will see something similar to the below screenshot.
Notes:
flow_id can help you correlate one event with other events that happened on the same flow. pcap_cnt indicates the number of the packet that triggered the alert (so you can inspect it further with a tool like Wireshark).
If you want a prettier representation, execute the following.
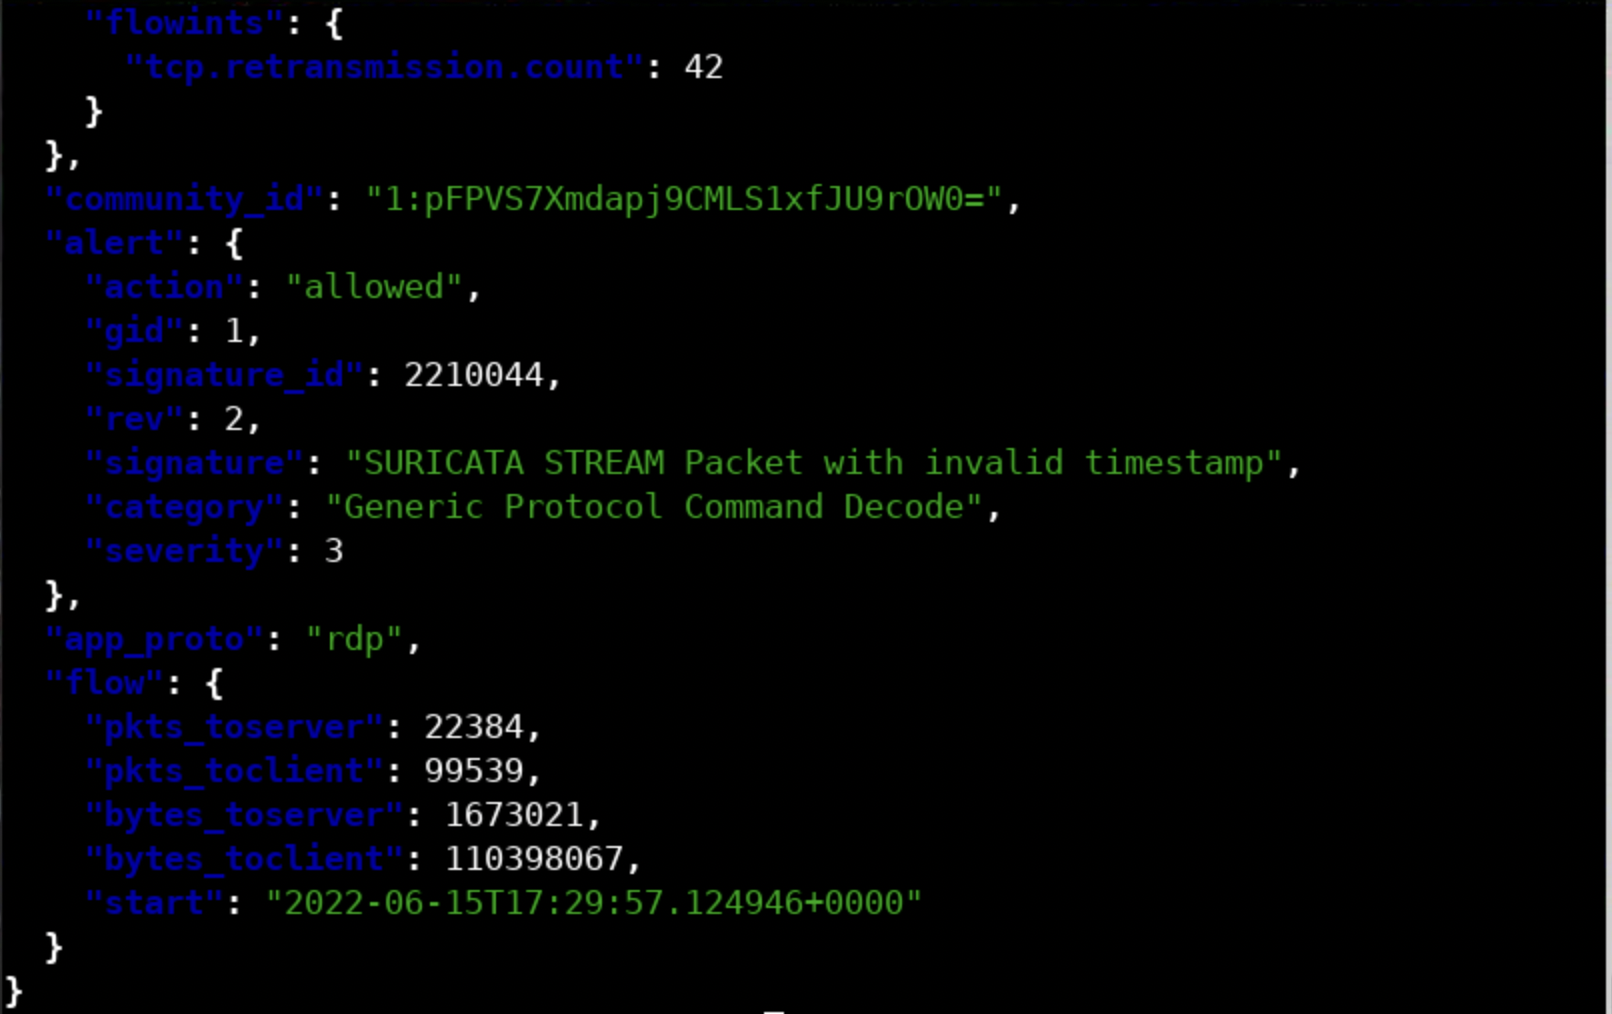
cat eve.json | jq 'select(.event_type == "alert")'If you do so, you will see the below.
Similarly, to filter out any TLS events, execute the following.
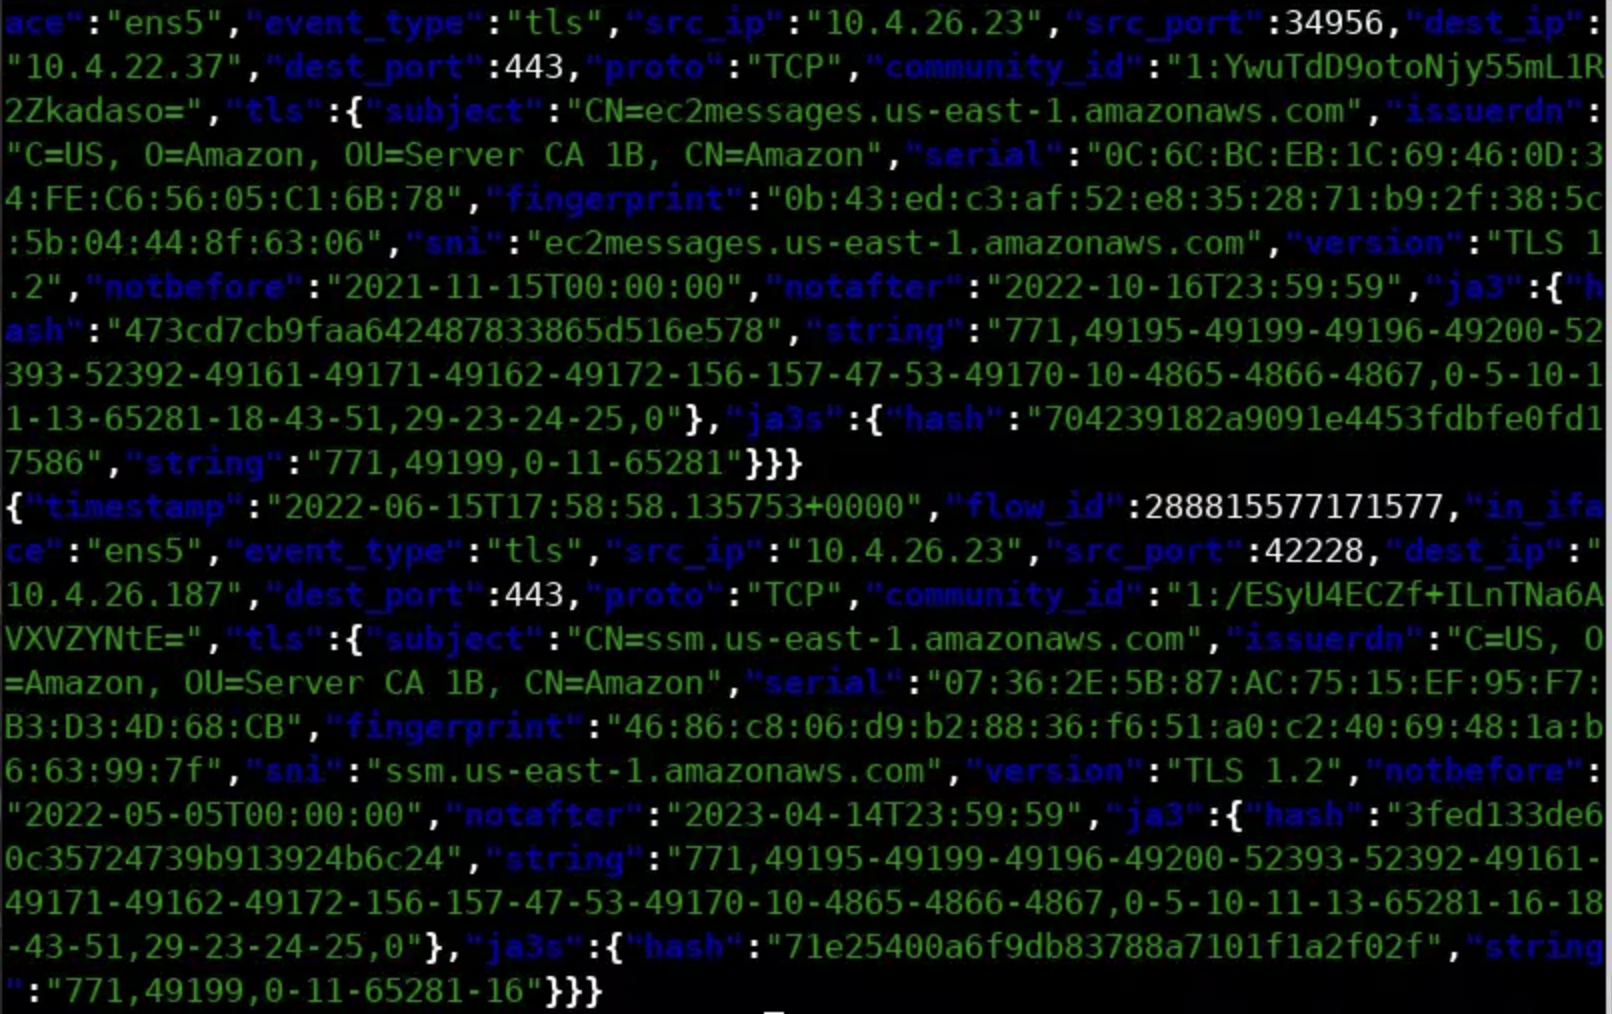
cat eve.json | jq -c 'select(.event_type == "tls")'You should see the below.
It should be noted that eve.json logs most of the event types. If you want a more targeted approach, you can disable EVE and enable specific outputs. Take for example HTTP events. The http-log has become obsolete with the introduction of EVE. You can still enable it though, as follows.
vim /etc/suricata/suricata.yaml
Enter /http-log and press the Enter key
Press Shift + i
Change enabled: from no to yes
Press the Esc key
Enter :wq and then, press the Enter key
Now, a new log http.log will be visible in each Suricata run (if any HTTP events occurred of course). To see this in action, execute the following after you enable the http-log.
suricata -r /root/Desktop/PCAPs/tls-suricata-ids-org.pcap
ls /var/log/suricata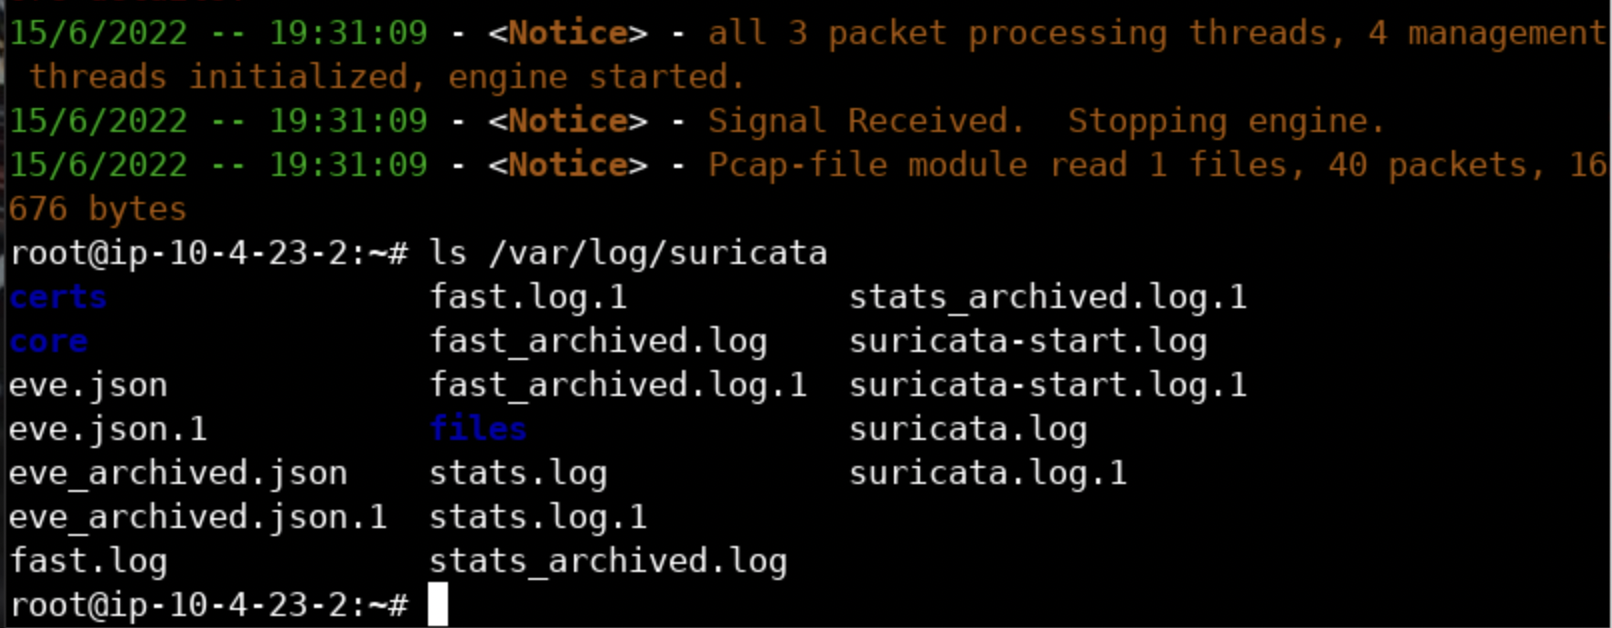
As a quick exercise, try enabling the file-log and file-store outputs. Then, run Suricata against the eicar-com.pcap file that resides inside the PCAPs folder. If you configured Suricata properly, the eicar test file will be stored inside the /var/log/Suricata/files directory. Hint: enable force-filestore as well.
Finally, in case you use Suricata in IPS mode, try enabling the drop output to have a more targeted look at the dropped packets. Of course, drop rules should be active in order for packets to be dropped by Suricata.
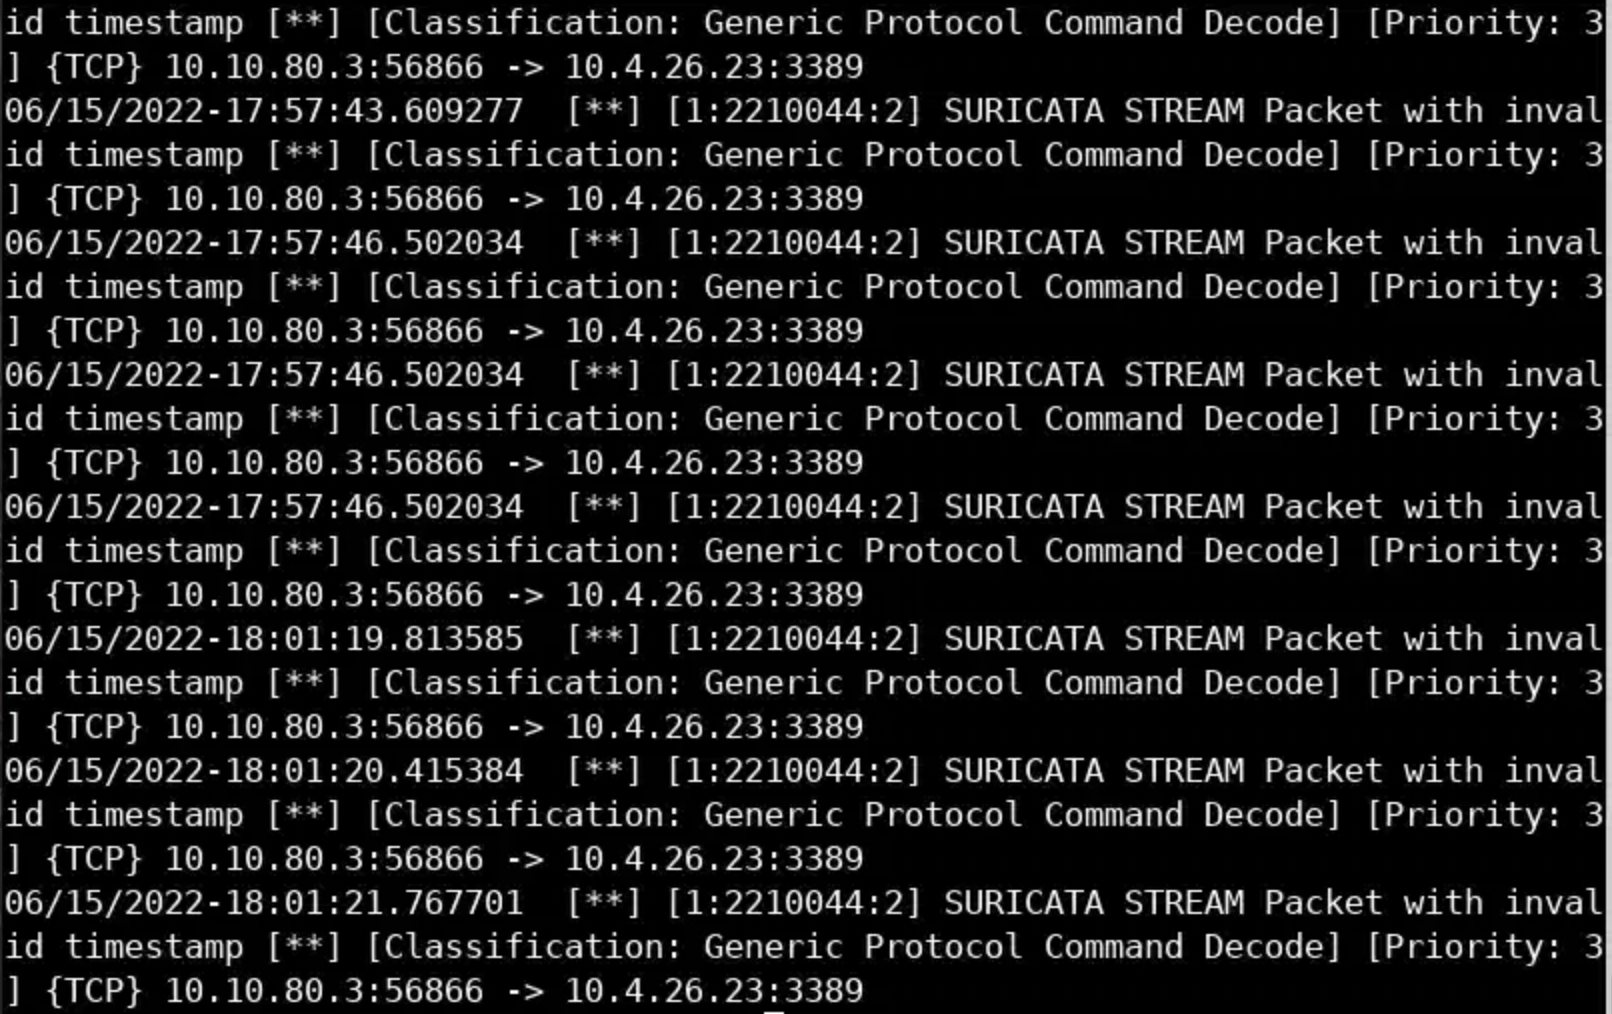
fast.log follows a text-based format (Snort users are familiar with it). It is enabled by default and logs alerts only.
Inside the /var/log/suricata directory, you will find a file named fast.log.
You can start inspecting it by executing the following.
cat fast.logYou should see the below.
As previously mentioned fast.log is a human-readable statistics log.
Inside the /var/log/suricata directory, you will find a file named stats.log
You can start inspecting it, by executing the following.
less stats.logYou should see the below.
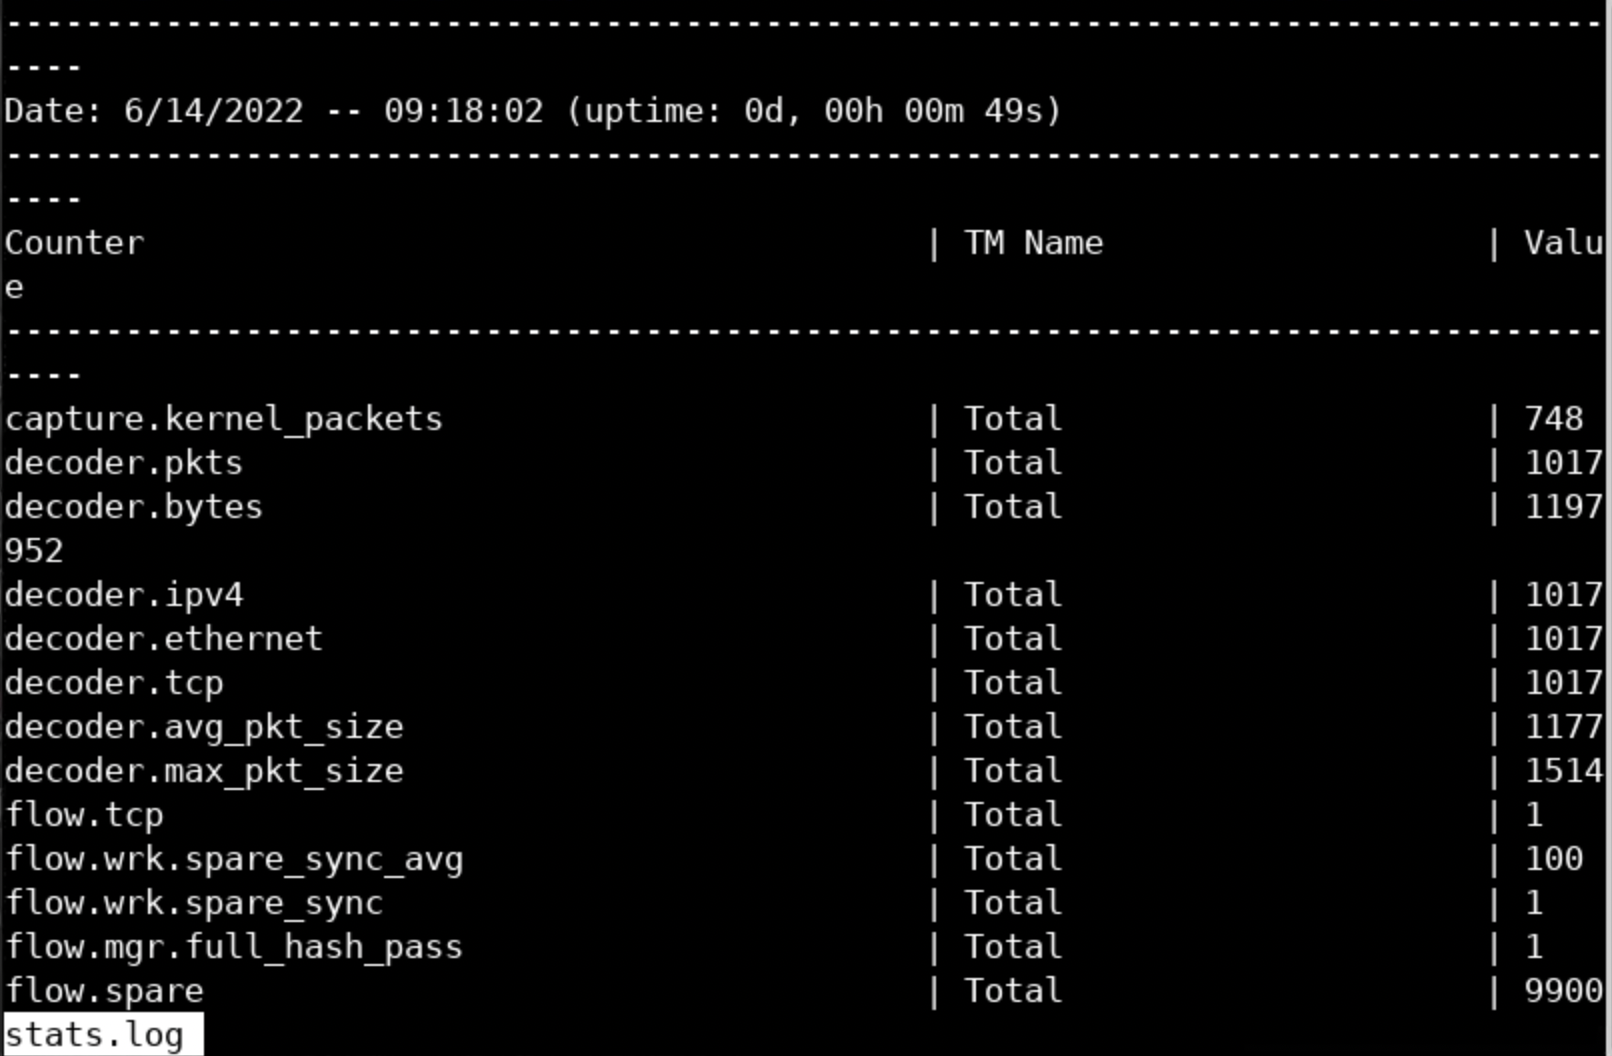
This output will prove handy while debugging Suricata deployments.
Other important Suricata outputs, which you can try enabling, are :
pcap-log <- Logs all packets to PCAP files (full packet capture)
alert-debug
Let's continue analyzing the Suricata output and make the best out of it. As always, let's start by taking another look at eve.json
What if one wanted to extract all the event types out of eve.json and sort them as well as aggregate them at the same time? This can be done as follows.
cat /var/log/suricata/eve.json | jq -c '.event_type'|sort|uniq -c|sort -nr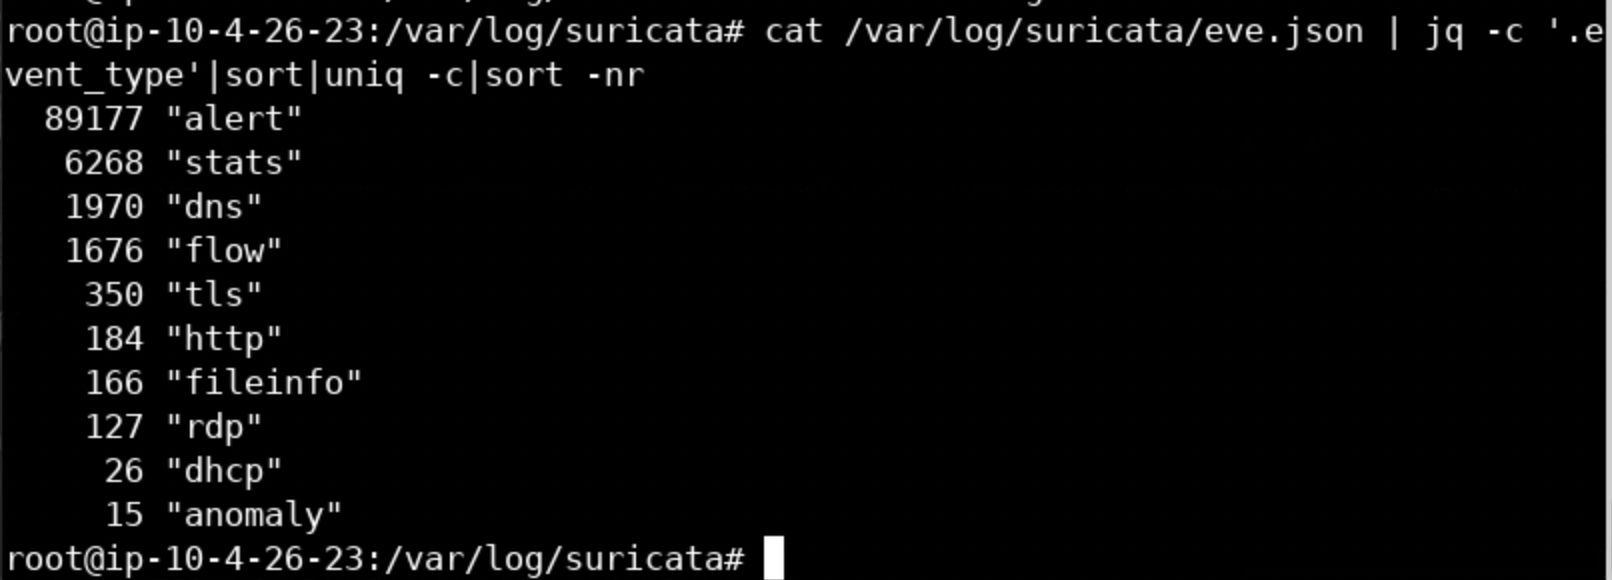
If one wanted to extract the latest alert out of eve.json, it can be done as follows.
cat /var/log/suricata/eve.json | jq -c 'select(.alert)'| tail -1 | jq .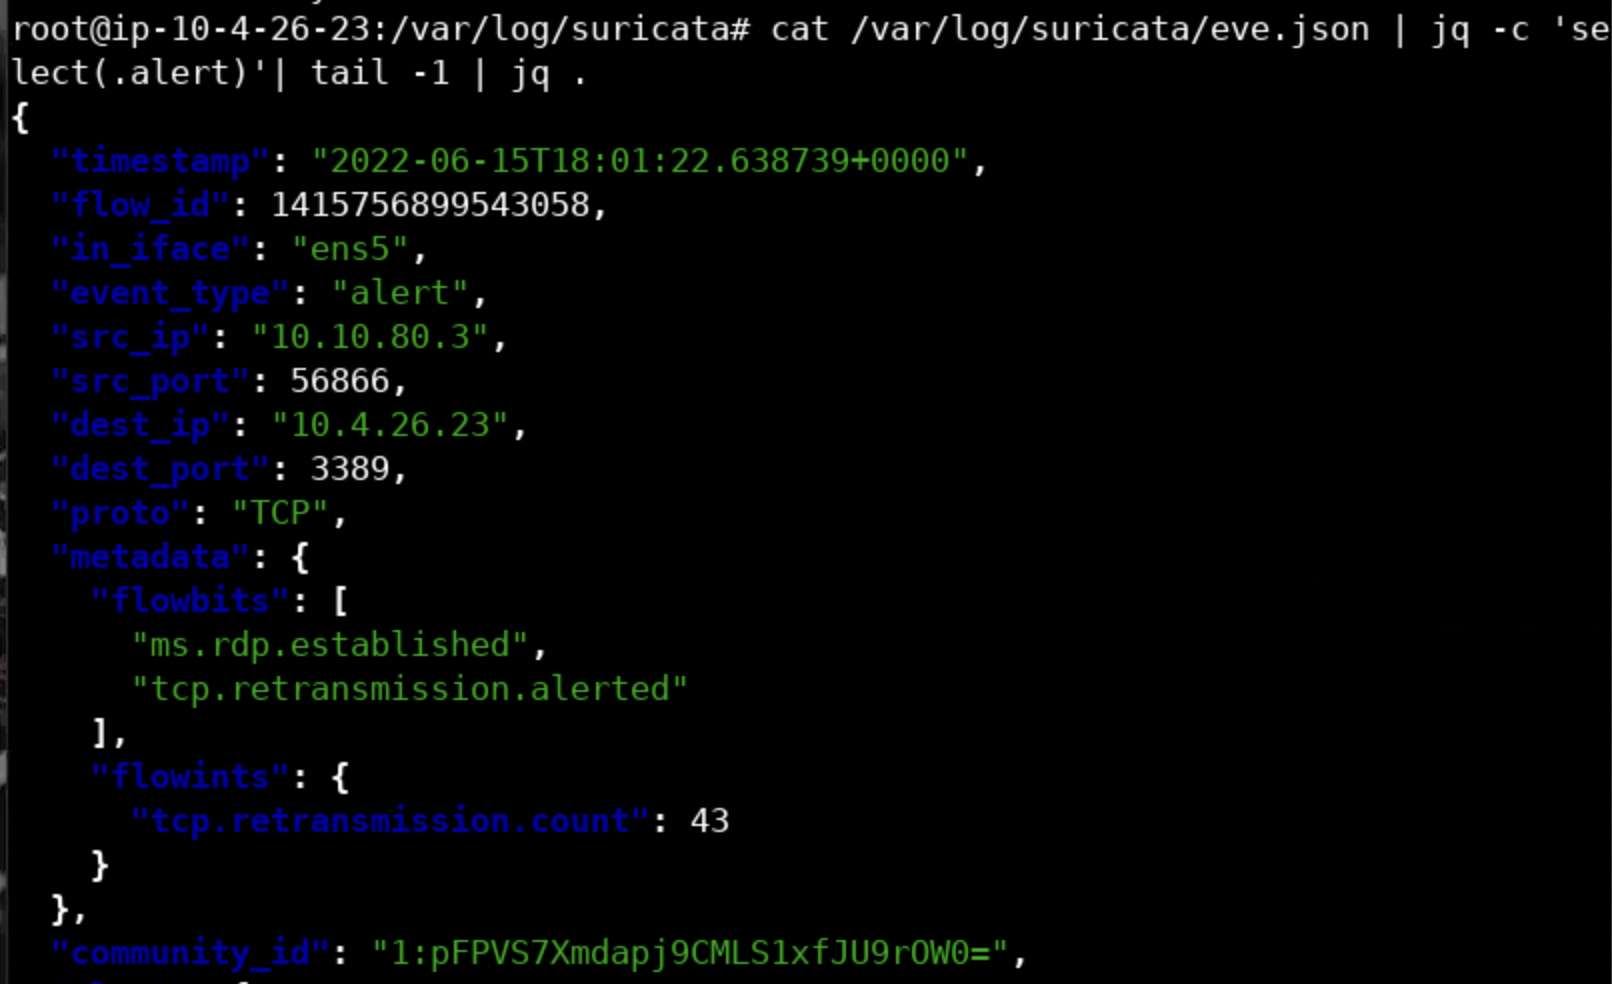
What if one wanted to extract the latest HTTP event out of eve.json? This can be done as follows.
cat /var/log/suricata/eve.json | jq -c 'select(.http)'| tail -1 | jq .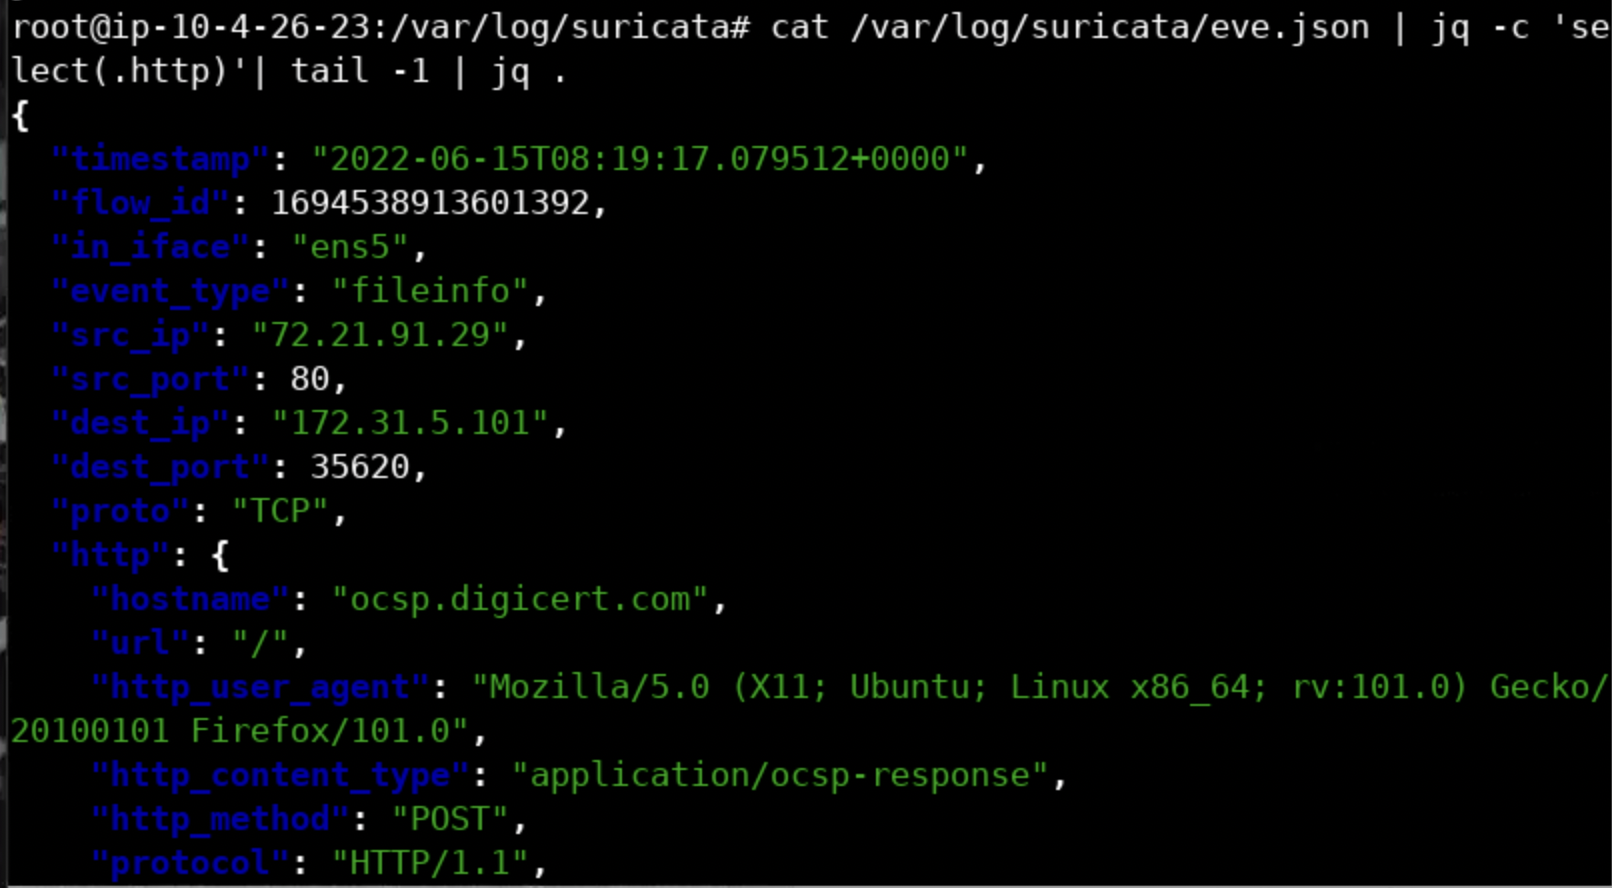
Try the same for the latest DNS and TLS event...
Going through and analyzing thousands (if not millions) of lines of data using jq is a tedious, not to mention ineffective, approach. Thank god EVE output is consumable by solutions like the ELK Stack and Splunk.
That being said, there is yet another convenient way to analyze Suricata output, EveBox.
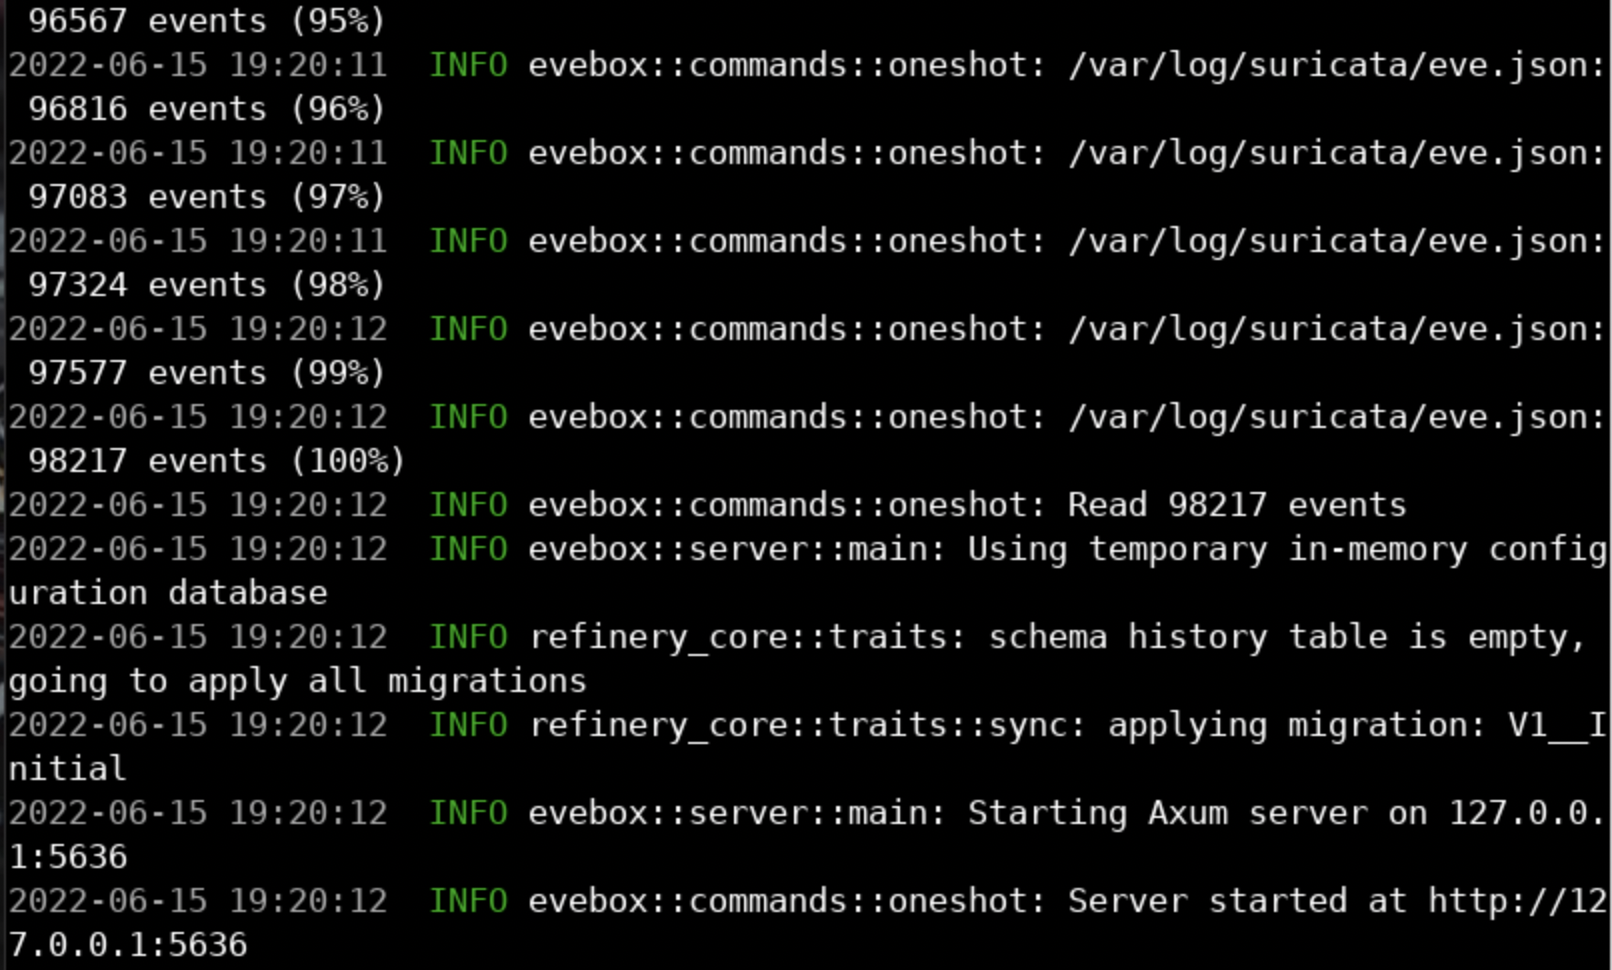
To analyze eve.json through EveBox, execute the below.
evebox oneshot /var/log/suricata/eve.jsonYou will come across the following.
You will be presented with a web browser as shown.
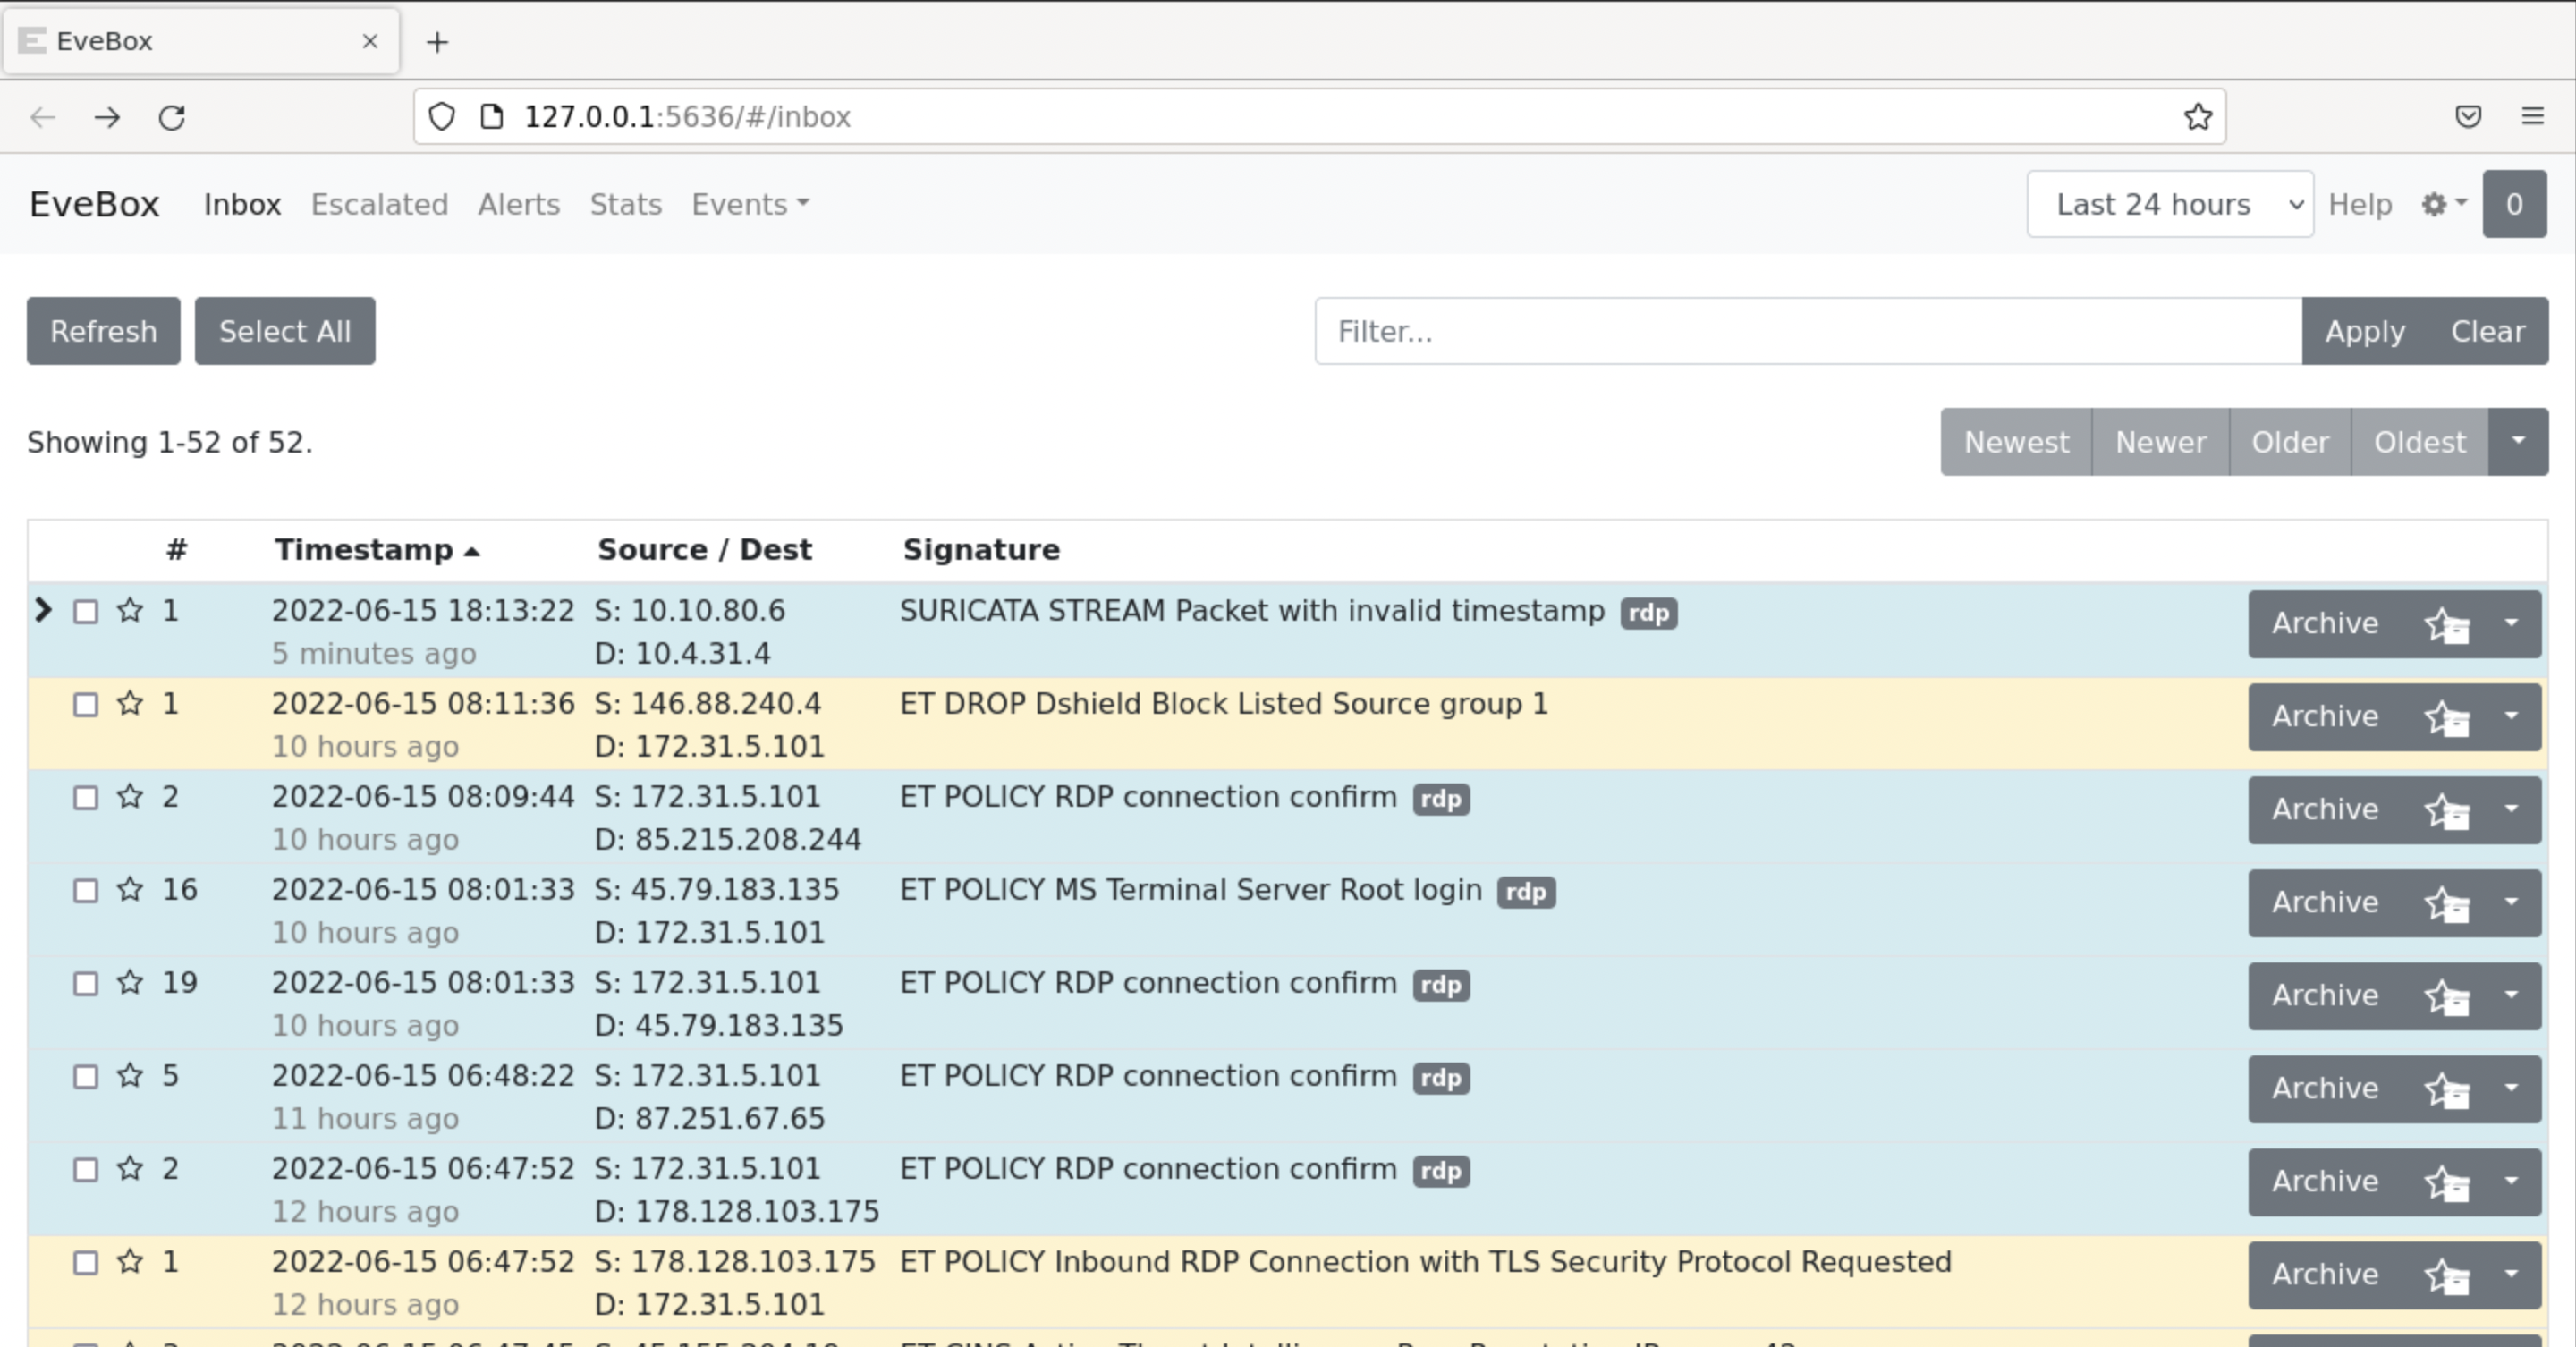
You will notice that EveBox parsed the whole eve.json and presented it to you in a much more organized way. Feel free to look around and get familiar with EveBox's layout and capabilities.
Let's see an example of EveBox's analysis capabilities.
Try the following... First, list all HTTP events.
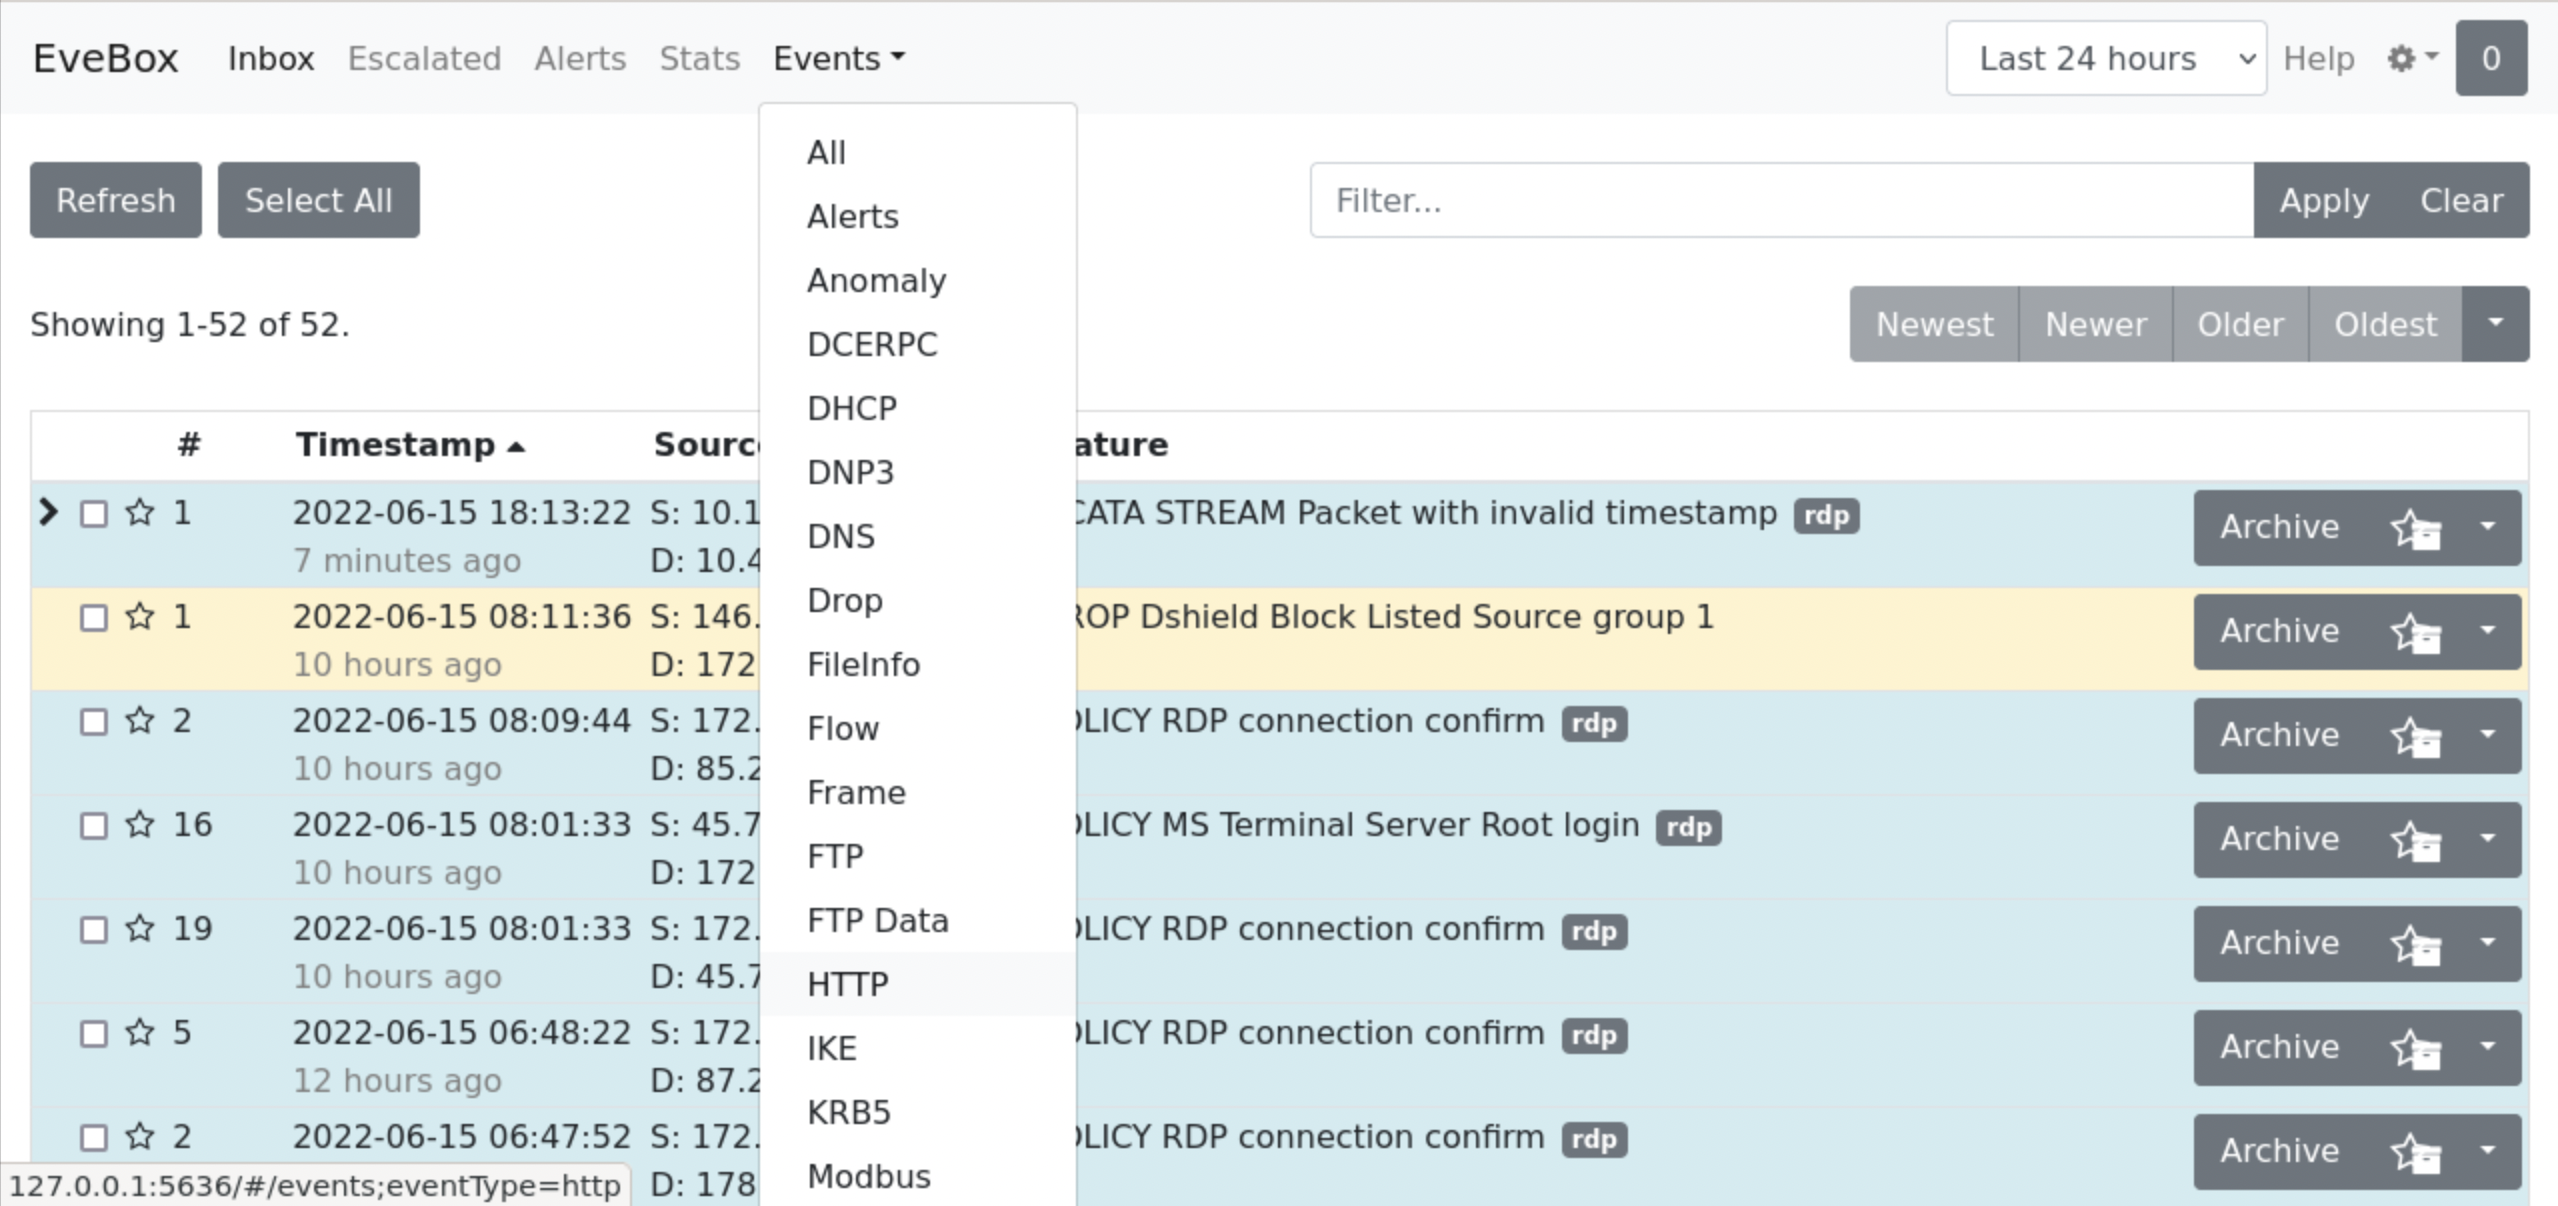
Then, choose the third entry.
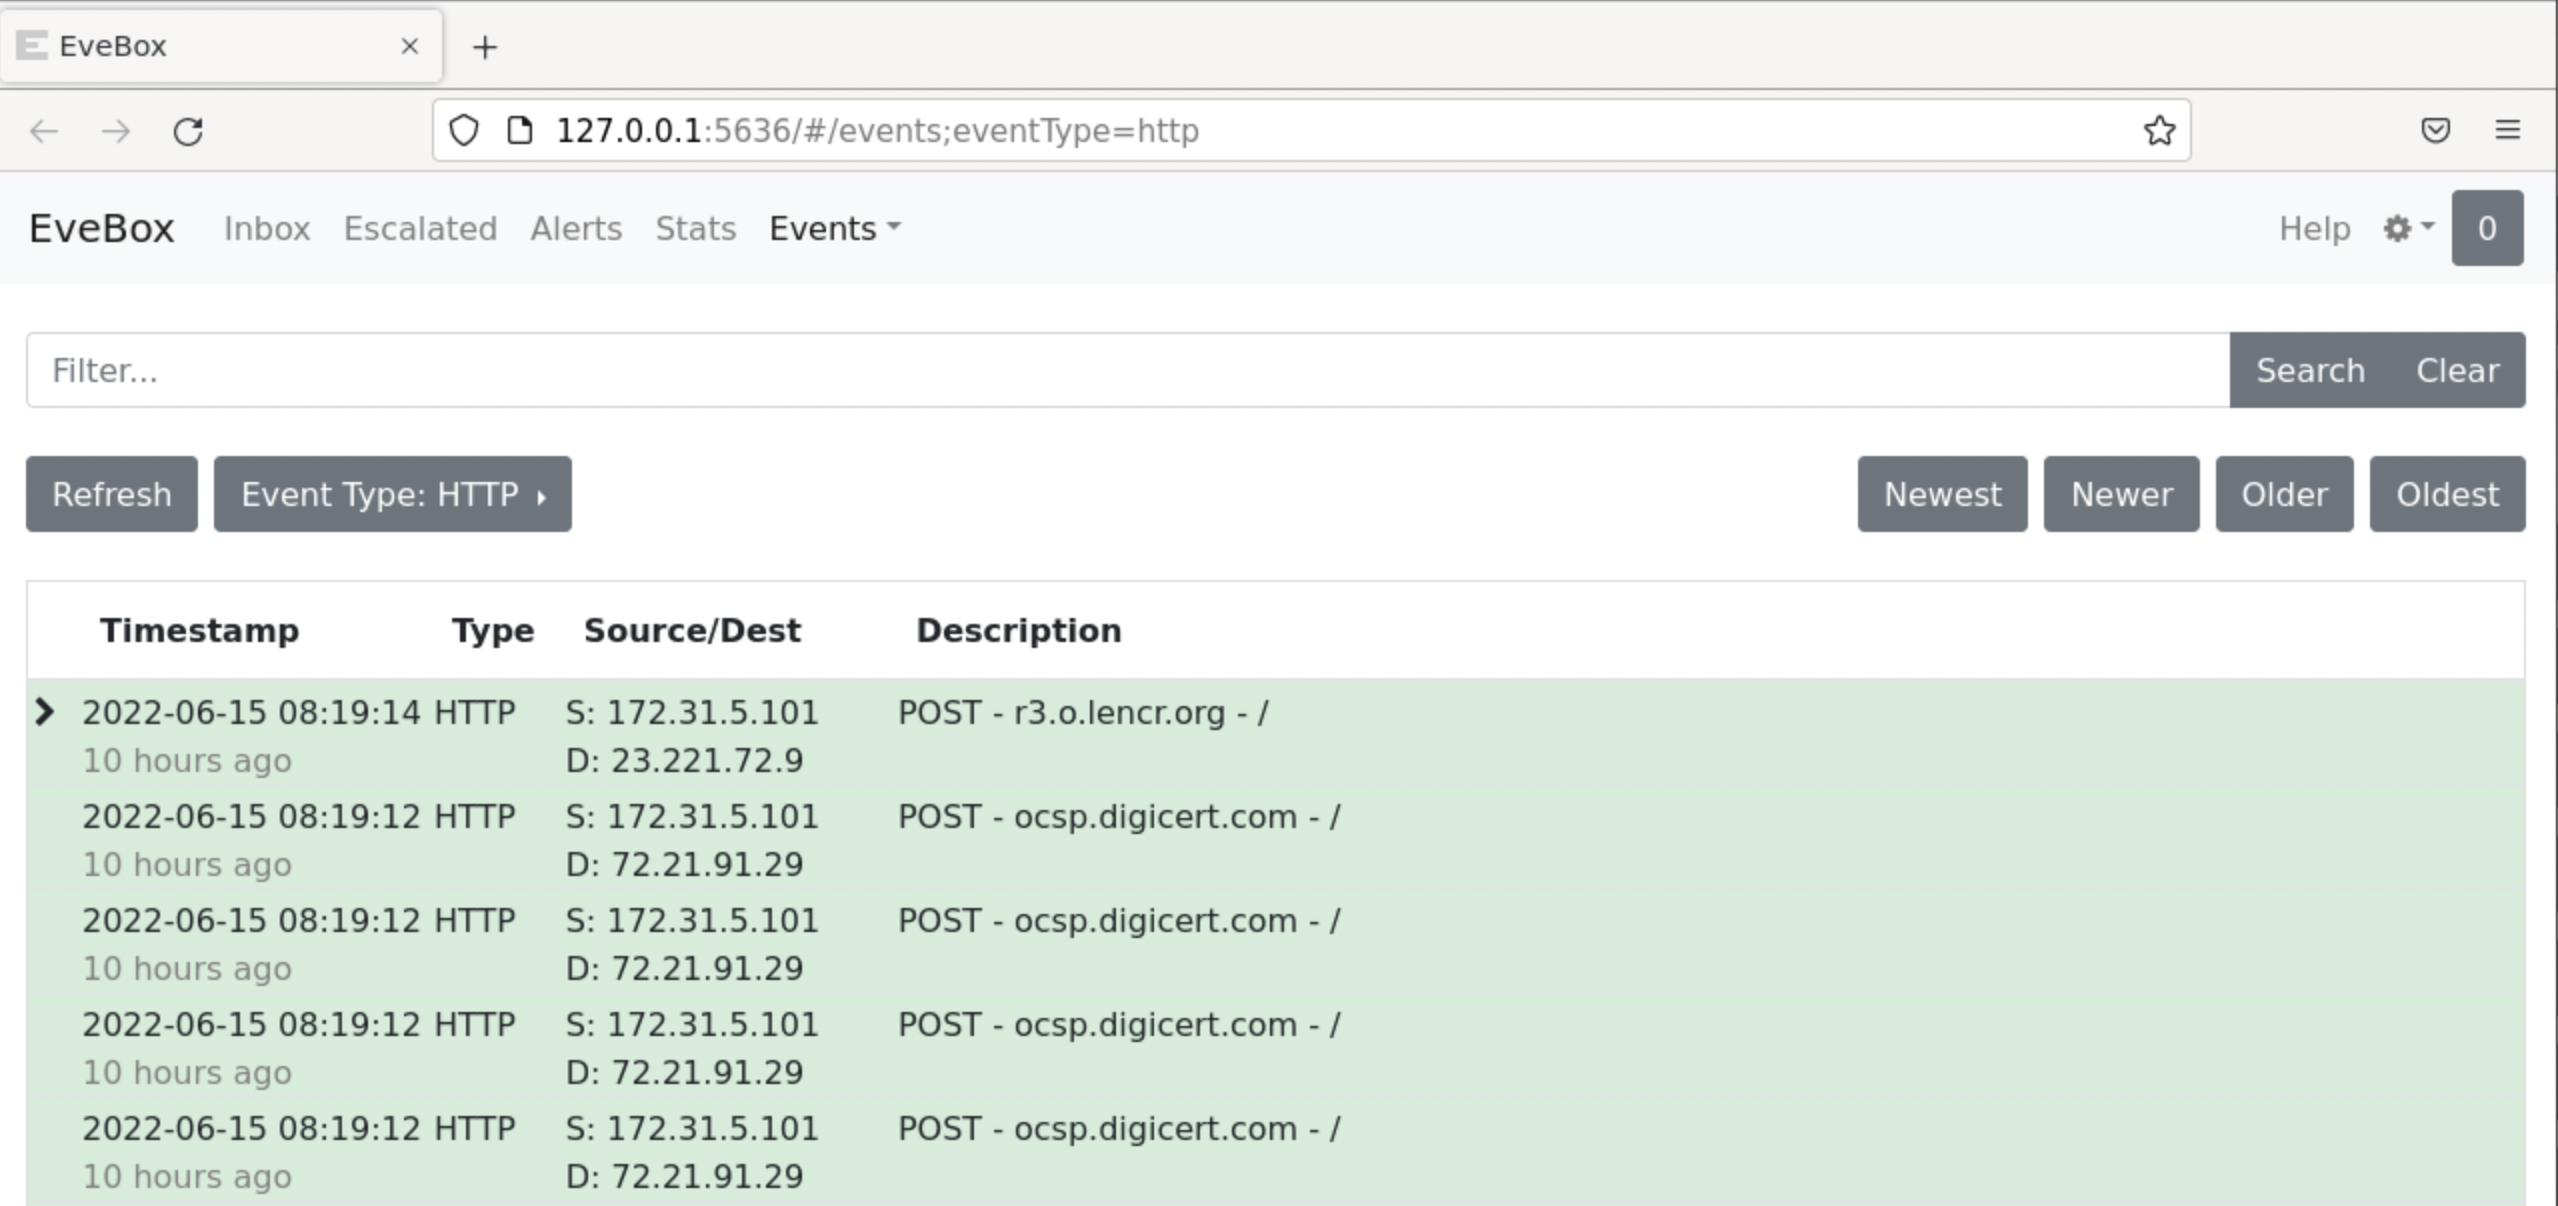
Finally, click on the Flow ID.
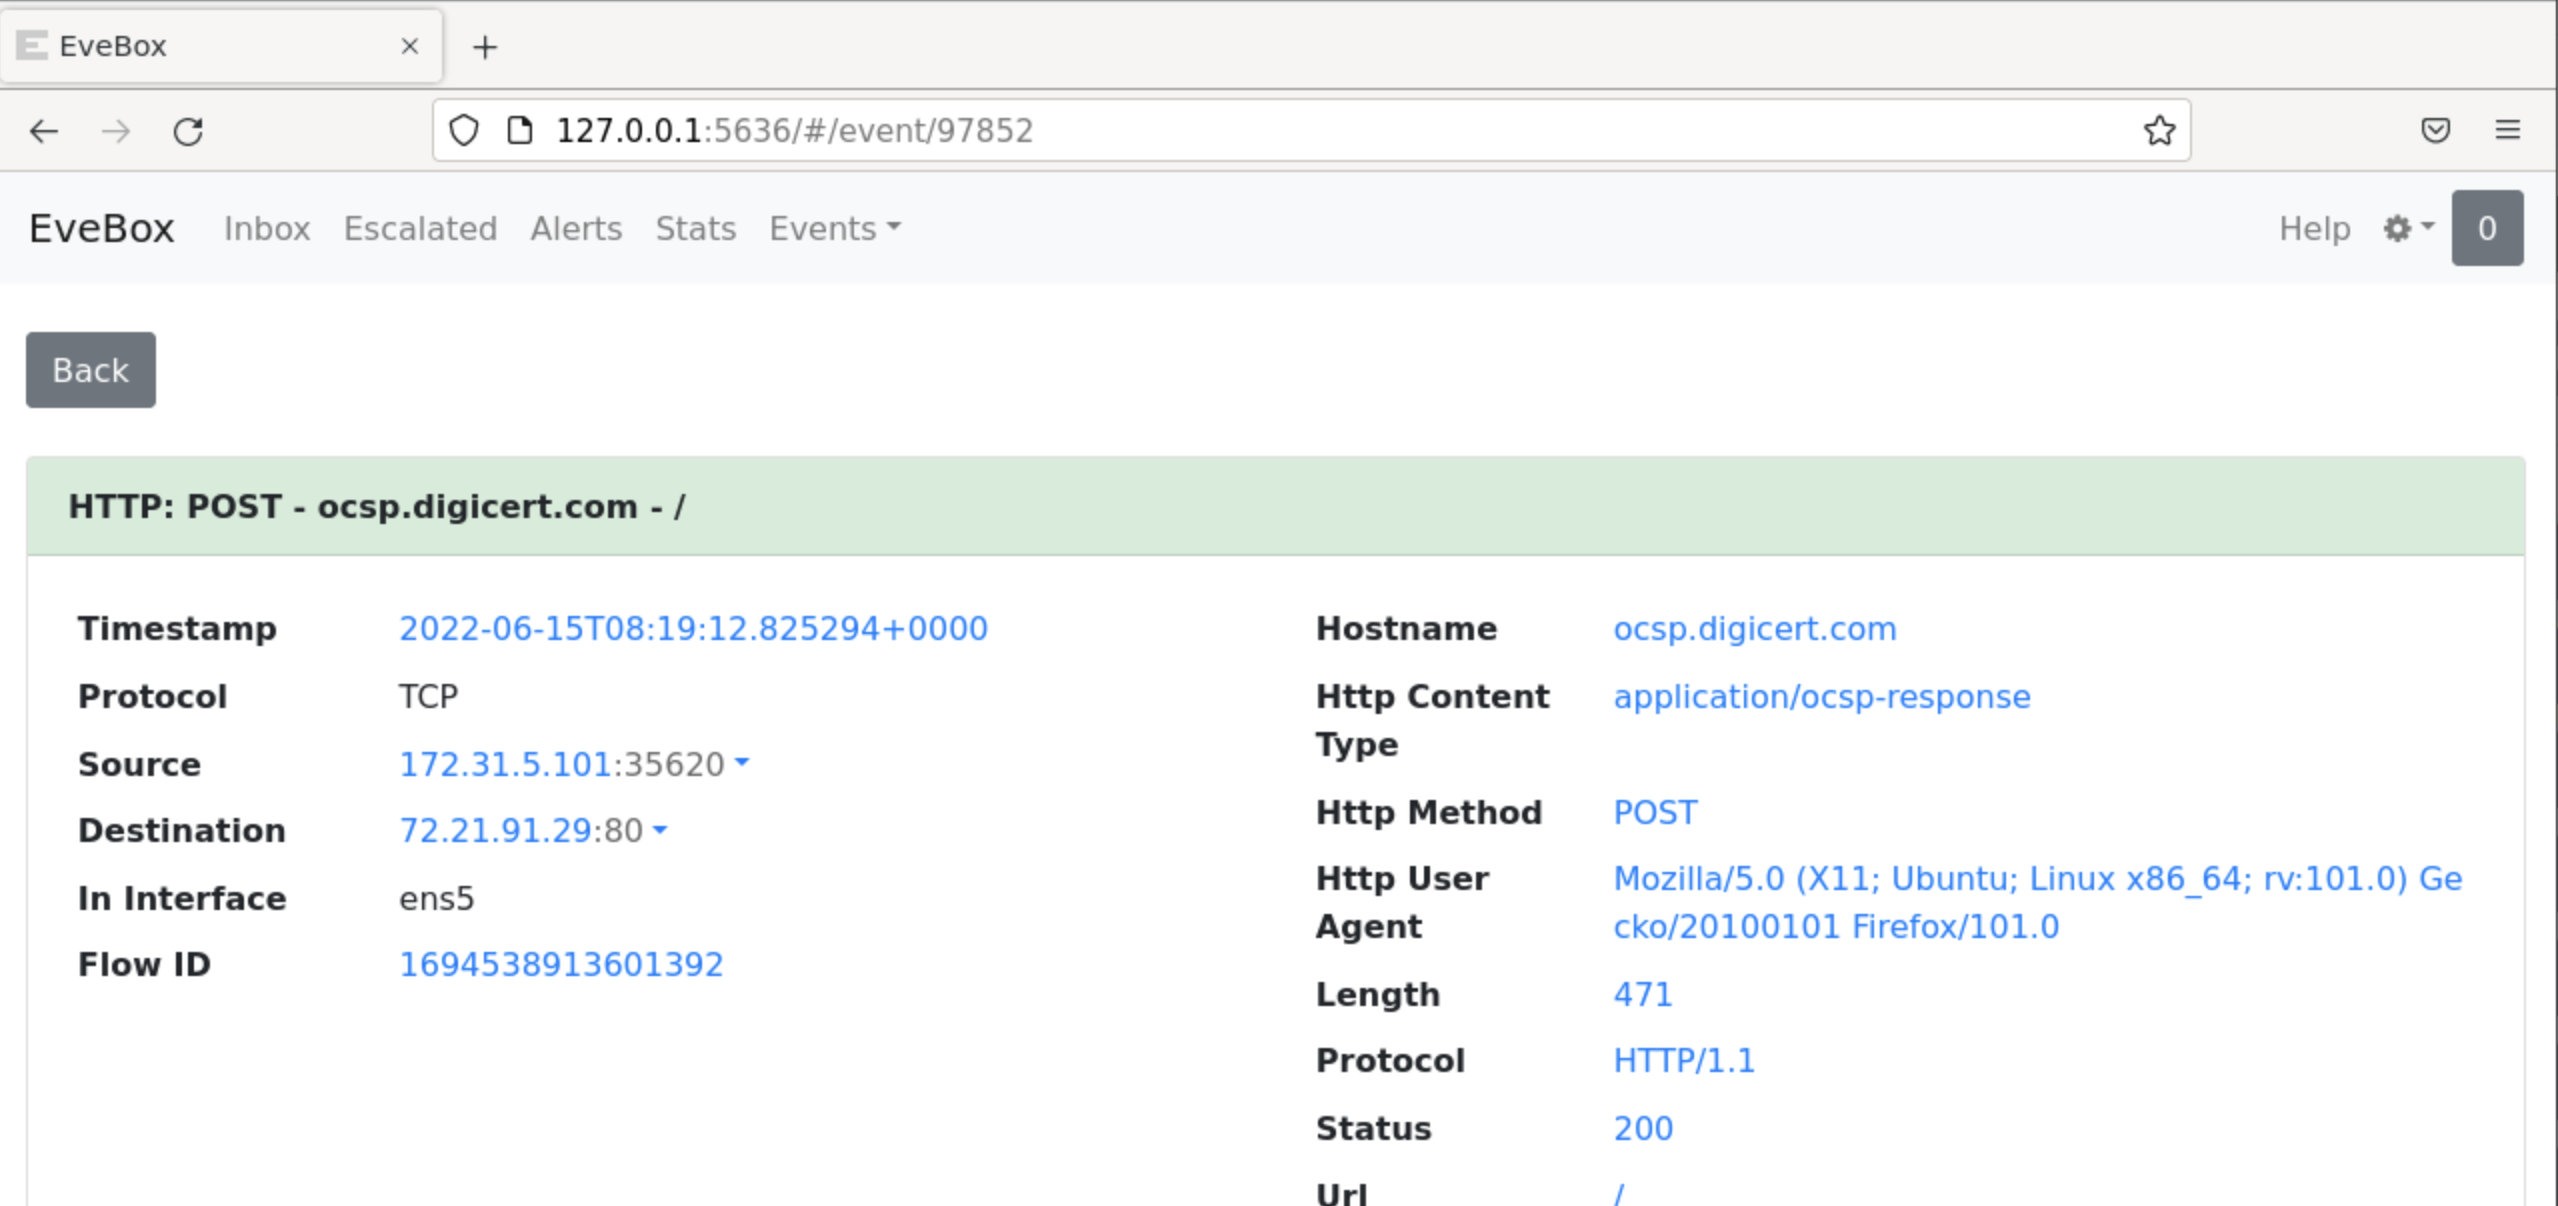
You will notice, that everything has been filtered based on the Flow ID you have just clicked! This is a great capability and "view" while performing an investigation.
Additional Resources: