NOTE: Bro is now Zeek!
The organization you work for is considering deploying Zeek (now known as Bro) to enhance its traffic inspection capabilities. Your IT Security manager tasked you with thoroughly analyzing zeek's capabilities. He also provided you with PCAP files containing malicious traffic, so that you can experiment with writing zeek detection scripts and signatures.
A test instance of zeek has already been set up and is waiting for you!
The learning objective of this lab is to not only get familiar with the detection capabilities of zeek but also to learn effective zeek scripting.
Specifically, you will learn how to use zeek's capabilities in order to:
Have better visibility over a network
Respond to incidents timely and effectively
Proactively hunt for threats
Zeek's creators describe it as an open-source traffic analyzer. It is typically used to inspect all traffic on a link (in depth) for signs of malicious or suspicious activity. That being said, Zeek can also be used for network troubleshooting and various measurements within a network. By deploying Zeek, blue teams can immediately access a variety of log files that contain all kinds of network activity, at a high level. More specifically, those logs contain not only detailed records of every connection on the wire but also application-layer transcripts (for example - DNS requests and the respective replies, whole HTTP sessions, etc.). Zeek does a lot more than just keeping track of the aforementioned. It is also shipped with a whole range of analysis and detection capabilities/functions.
What is important to know is that Zeek exposes an extremely capable scripting language to its users (to develop Zeek scripts, the equivalent of Suricata rules). This key feature makes Zeek a fully customizable and extensible platform, based on which blue team members can create their own analysis and detection logic/posture.
If we combine that fact that Zeek runs on commodity hardware with its capable scripting language, we can easily conclude that we are not dealing with yet another signature-based IDS. Zeek is a platform that could also facilitate semantic misuse detection, anomaly detection, and behavioral analysis.
The most important Zeek features and capabilities are:
Comprehensive logging of network activity
Analysis of application-layer protocols (regardless of the port, covering protocols like HTTP, DNS, FTP, SMTP, SSH, SSL, etc.)
Ability to look into file content exchanged over application-layer protocols
IPv6 support
Tunnel detection and analysis
Ability to perform sanity checks during protocol analysis
IDS-like pattern matching
Scripting Language
Facilitates the expression of arbitrary analysis tasks
Event-based programming model
Domain-aware
Can facilitate tracking and managing network state over time
Interfacing
Outputs to well-structured ASCII logs, by default
Alternative backends for ElasticSearch and DataSeries
External input can be integrated into analyses, in real-time
External C library for exchanging Bro events with external programs
Ability to trigger arbitrary external processes from within the scripting language
Zeek operation modes:
Fully passive traffic analysis
libpcap interface for capturing packets
Real-time and offline (for example, PCAP-based) analysis
Cluster-support for large-scale deployments
Zeek architecture and events:
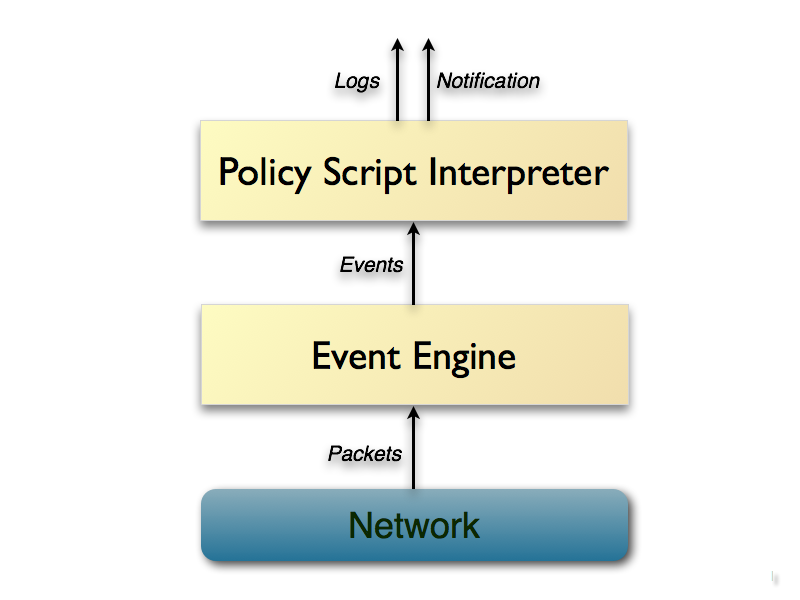
Zeek consists of two main components, the event engine (or core) and the script interpreter.
The event engine "transforms" an incoming packet stream into a series of high-level events. In Zeek language, these events lay any network activity out in policy-neutral terms; this means that they inform us of what has been spotted, but not if it requires attention or how/why it got there in the first place. For example, all spotted HTTP requests will be "transformed" into http_request events. These events carry every request detail/component, but they don't include any level of interpretation, e.g., of whether a port corresponds to a known port used by malware.
Such interpretation is offered through Zeek's second main component, the script interpreter. Under the hood, the script interpreter executes a set of event handlers written in Zeek's scripting language (Zeek scripts); this is actually how a site's security policy is expressed when Zeek is used. By security policy we mean, for example, the actions to occur immediately after detection.
Events generated by Zeek core are placed into an ordered "event queue" to be handled in a first-come-first-serve order.
| Event Name | Event Description |
|---|---|
| rdp_begin_encryption | Generated when an RDP session becomes encrypted |
| rdp_client_core_data | Generated for MCS client request |
| rdp_connect_request | Generated for X.224 client requests |
| rdp_gcc_server_create_response | Generated for MCS server responses |
| rdp_negotiation_failure | Generated for RDP Negotiation Failure messages |
| rdp_negotiation_response | Generated for RDP Negotiation Response messages |
| rdp_server_certificate | Generated for a server certificate section |
| rdp_server_security | Generated for MCS server responses |
For a more comprehensive list, refer to the following resource: https://docs.zeek.org/en/stable/scripts/base/bif/
Zeek logs:
When we use Zeek for offline analysis of a PCAP file though, Zeek logs will be stored in the current directory.
Some known Zeek logs are:
conn.log: IP, TCP, UDP, and ICMP connection details
dns.log: DNS query/response details
http.log: HTTP request/reply details
ftp.log: FTP request/reply details
smtp.log: SMTP transactions, e.g., sender and receiver
If we take, for example, the http.log Bro log, it includes numerous useful information such as:
host: HTTP domain/IP
uri: HTTP URI
referrer: HTTP request referrer
user_agent: Client user agent
status_code: HTTP status code
Note that in its default setup, Zeek will gzip compress log files every passing hour. The old logs will be moved into a directory with a YYYY-MM-DD format. In the case of dealing with compressed logs, you can use alternative tools such as gzcat to print logs or zgrep to search in them.
For zeek examples, use cases and the basics of writing Bro scripts, refer to the following link: https://docs.zeek.org/en/stable/examples/index.html
For a quick start guide, refer to the following link: https://docs.zeek.org/en/stable/quickstart/index.html
Spend time studying the resources above before proceeding to the lab's tasks.
Below, you can find solutions for every task of this lab. Remember though, that you can follow your own strategy (which may be different from the one explained in the following lab.
Let's first set zeek's path as environment variable so that we can access it globally. We can do so with the help of following command -
export PATH=/opt/zeek/bin/:$PATHNOTE: If you are closing this lab, you need to run the above mentioned command again in order to set the zeek's path.
Now, let's introduce a script file to handle the rdp_connect_request event, according to the requirements of Task 1
cd ~/Desktop
mkdir zeek
cd zeek
nano test.zeek
Inside nano (in 'test.zeek'), type the below code-
@load base/protocols/rdp
event rdp_connect_request(c: connection, cookie:string)
{
    print cookie;
}
In the first line, we simply imported all of the base functionality already implemented in Zeek, regarding RDP analysis. Then, we defined the event handler, instructing it to only print the cookie of the request. What is important to remember, is that the event declaration should be identical to the one shown in the Zeek rdp_connect_request.
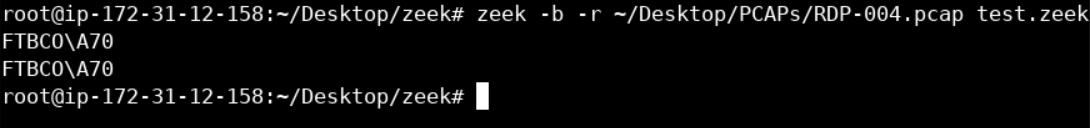
Now, let's execute Zeek and specify the RDP-004.pcap PCAP file as well as the script we just created.
zeek -b -r ~/Desktop/PCAPs/RDP-004.pcap test.zeekThe -b flag is used so as to not automatically load all scripts under base (which is the default behavior).
The -r flag is used to execute Zeek for offline analysis of a provided traffic capture file.
Placing a Zeek script at the end of the command will load the specified Zeek script.
You should see something similar to the following.
What if we wanted some more information from the connection request, such as the source address and the start time (in Unix time), all printed in one line?
We could do so, by extending our Zeek script (nano test.zeek again), as follows.
@load base/protocols/rdp
event rdp_connect_request(c:connection, cookie:string)
{
local start_time = strftime("%Y-%m-%d %H:%M:%S", c$start_time );
print fmt("New RDP Requst from: %s at %s by user %s", c$id$orig_h, start_time , cookie);
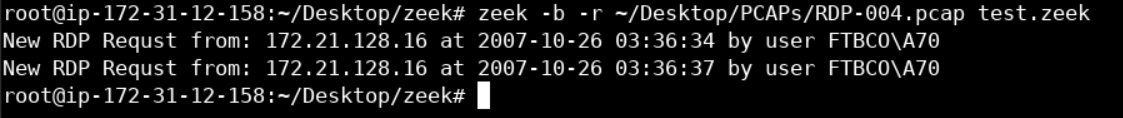
}Now, let's execute Zeek and specify the RDP-004.pcap PCAP file as well as the extended script we just created.
zeek -b -r ~/Desktop/PCAPs/RDP-004.pcap test.zeekYou should see something similar to the following.
To make our Zeek script fulfill the requirements of Task 1 (alert us on any RDP connection initiated by a user different than "admin"), we have to implement two additional things.
Instead of just printing the log into standard output, we would like the Zeek output to be logged into a file for better and more effective monitoring; this is where Zeek's "notice" framework comes into play. The "notice" framework is used when we want Zeek to alert us on suspicious or malicious activity. When writing a Zeek script, we can raise such an alert by simply calling the NOTICE function.
We should also introduce functionality that compares the observed username in the RDP connection to the username "admin" and alerts us in case of a mismatch.
Both the above can be easily implemented, as follows (below is the final version of our Zeek script).
@load base/protocols/rdp
@load base/frameworks/notice
export { redef enum Notice::Type += {Suspicious_RDP}; }
event rdp_connect_request(c: connection, cookie:string){
    if (cookie != "admin"){
        local start_time = strftime("%Y-%m-%d %H:%M:%S", c$start_time );
        local message = fmt("New RDP Request from: %s at %s by user %s", c$id$orig_h, start_time , cookie);
        NOTICE([$note= Suspicious_RDP, $msg=message]);
    }
}
Finally, let's execute Zeek and specify the RDP-004.pcap PCAP file as well as the final version of our script.
zeek -b -r ~/Desktop/PCAPs/RDP-004.pcap test.zeekYou should see nothing in the standard output, but you will find a new Zeek log named notice.log in the current directory.
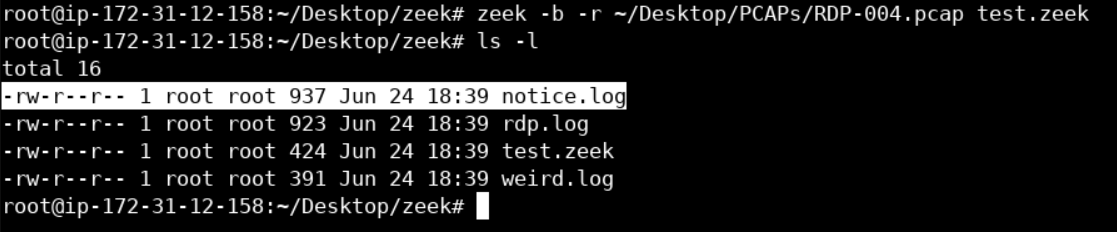
notice.log contains the alert messages we specified in the final version of our Zeek script.
cat notice.log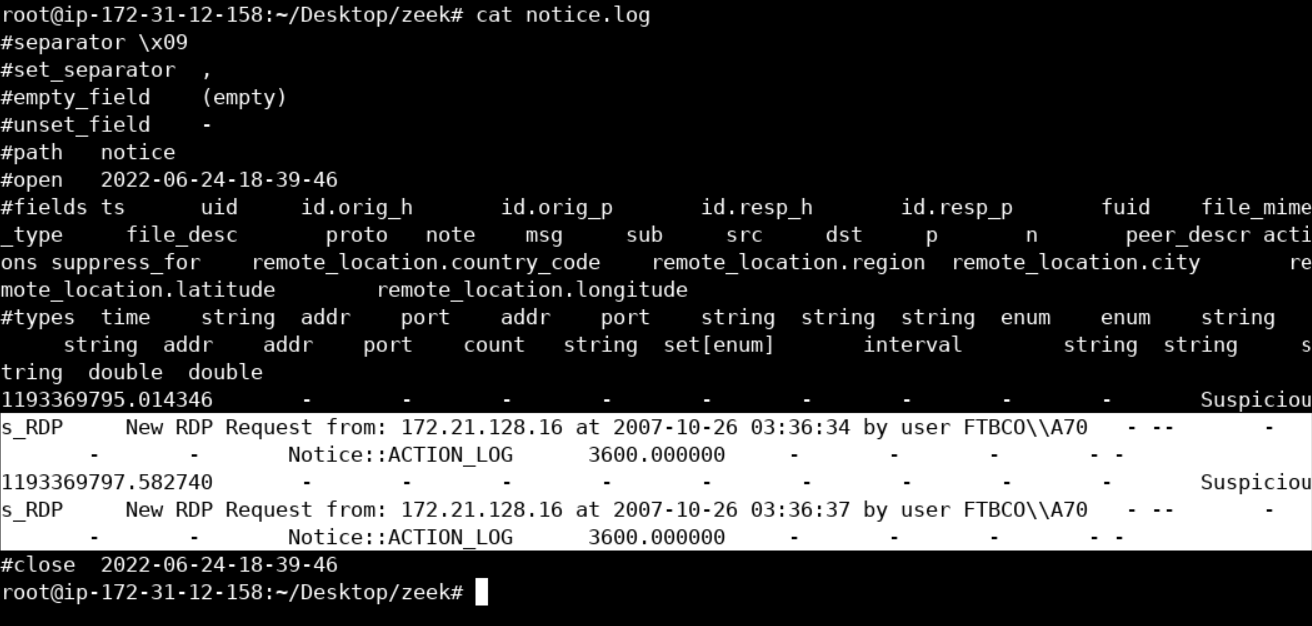
First, delete any previously generated logs in the current directory.
Run -
cd ..
rm -r zeek
mkdir zeek
cd zeek
Let's start our analysis, by executing Zeek as follows.
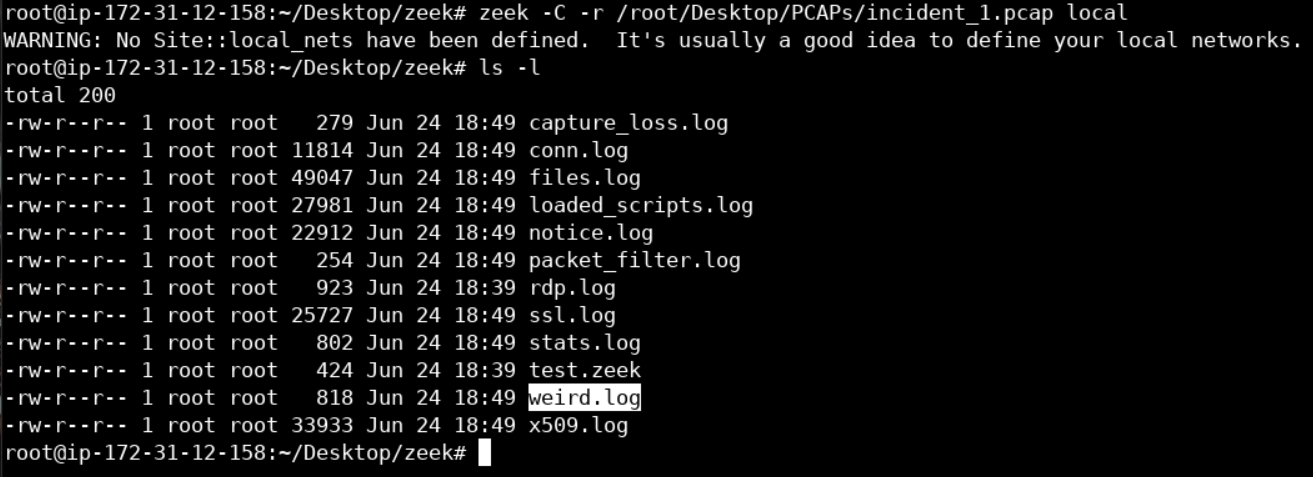
zeek -C -r /root/Desktop/PCAPs/incident_1.pcap local-C is used to ignore invalid TCP checksums.
You should see nothing important in the standard output, but various Zeek logs being created, as follows.
Now run ls -l
Let's take a look at weird.log. weird.log contains unusual/exceptional activity that can indicate malformed connections, traffic that doesn't conform to a particular protocol or even a malicious actor trying to evade or confuse a sensor.
cat weird.logYou should see something similar to the below.
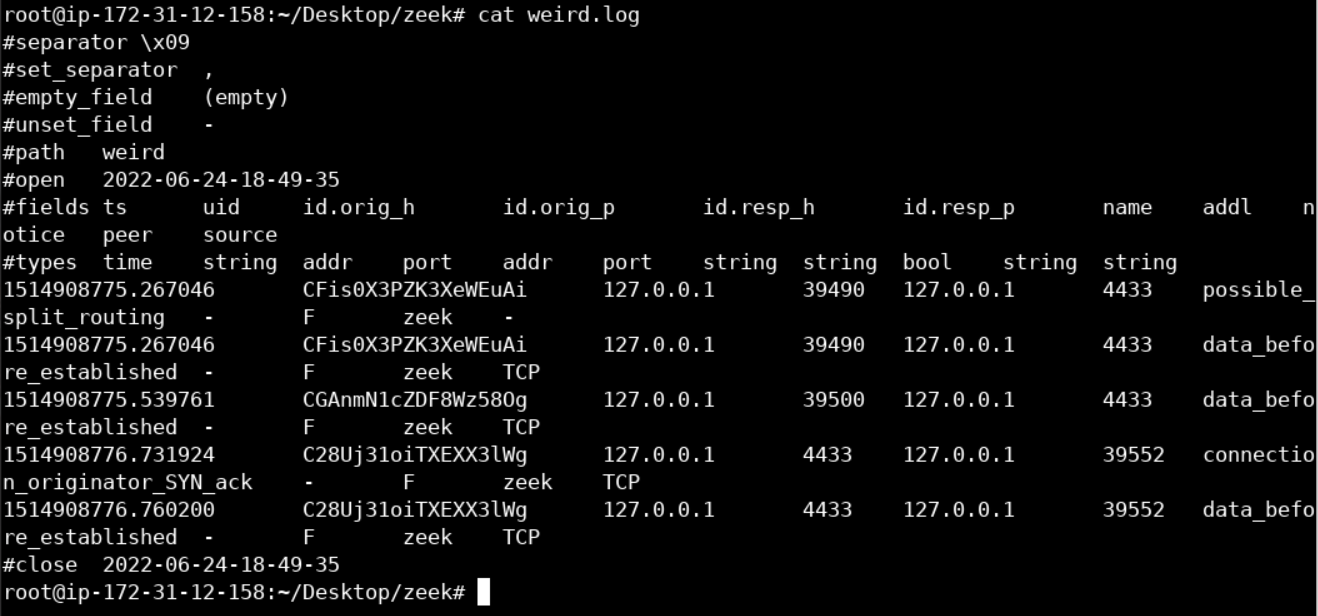
Nothing conclusive. Let's move on.
Let's now inspect the contents of notice.log, as follows.
cat notice.log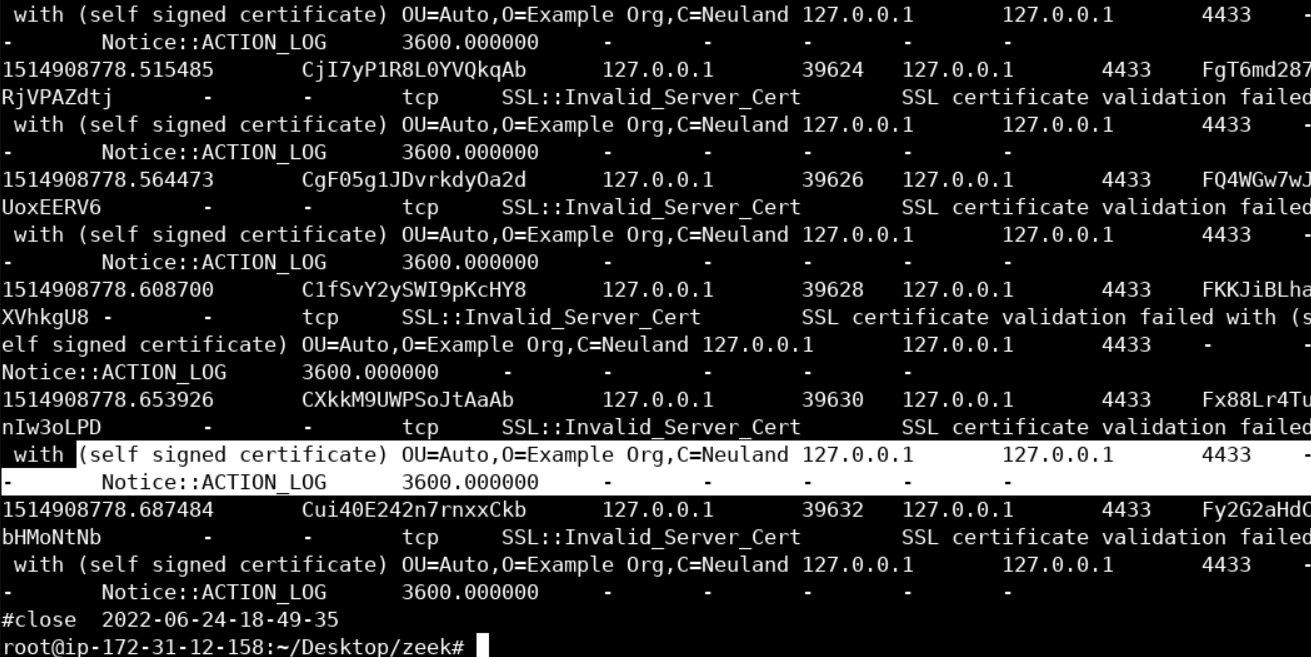
First of all, notice that even though we see port 4433 (TCP), Zeek was still able to identify that what it sees is SSL traffic. Disregard 127.0.0.1, the PCAP is from a run using local loopback.
What you should also notice, are those "self signed certificate" messages. Unfortunately, self-signed certificates are quite common, even nowadays. So, nothing suspicious yet. Those "default" values on the SSL certificates (marked in yellow) are interesting!
We should not forget that malicious actors are known for both using self-signed SSL certificates and being lazy, so, let's take a closer look.
SSL certificates are quite valuable when it comes to responding to SSL-powered malware; this is because they are transmitted unencrypted. Unfortunately, Zeek doesn't extract every observed SSL certificate, by default. Let's configure it, so that it does, as follows.
nano /opt/zeek/share/zeek/site/local.zeekInside nano, append the following at the end of the local.zeek file. (Already present in the lab setup, just verify it is there or not.)
@load protocols/ssl/extract-certs-pem
redef SSL::extract_certs_pem = ALL_HOSTS;
This will extract all observed SSL certificates and store them inside a big certs-remote.pem file.
If you run zeek once again, you will notice this big certs-remote.pem file, in the current directory.
Run -
zeek -C -r /root/Desktop/PCAPs/incident_1.pcap local
ls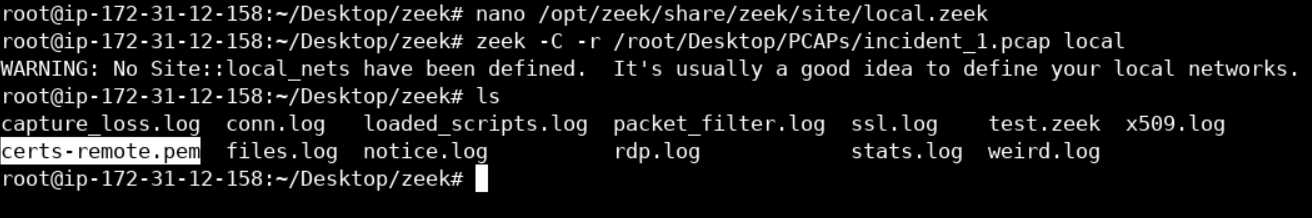
Now, let's move that certs-remote.pem file in a temp directory and split it into all the separate .pem files that constructed it. This can be done as follows.
mkdir temp
mv certs-remote.pem temp
cd temp
awk ' split_after == 1 {close(n".pem"); n++;split_after=0} /-----END CERTIFICATE-----/ {split_after=1} { print > n".pem"}' <certs-remote.pemRun-
ls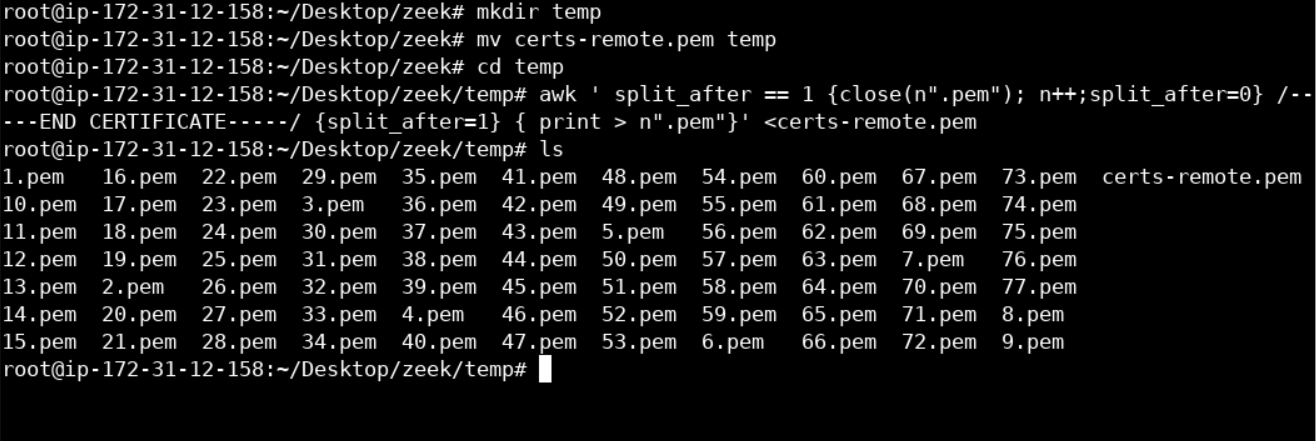
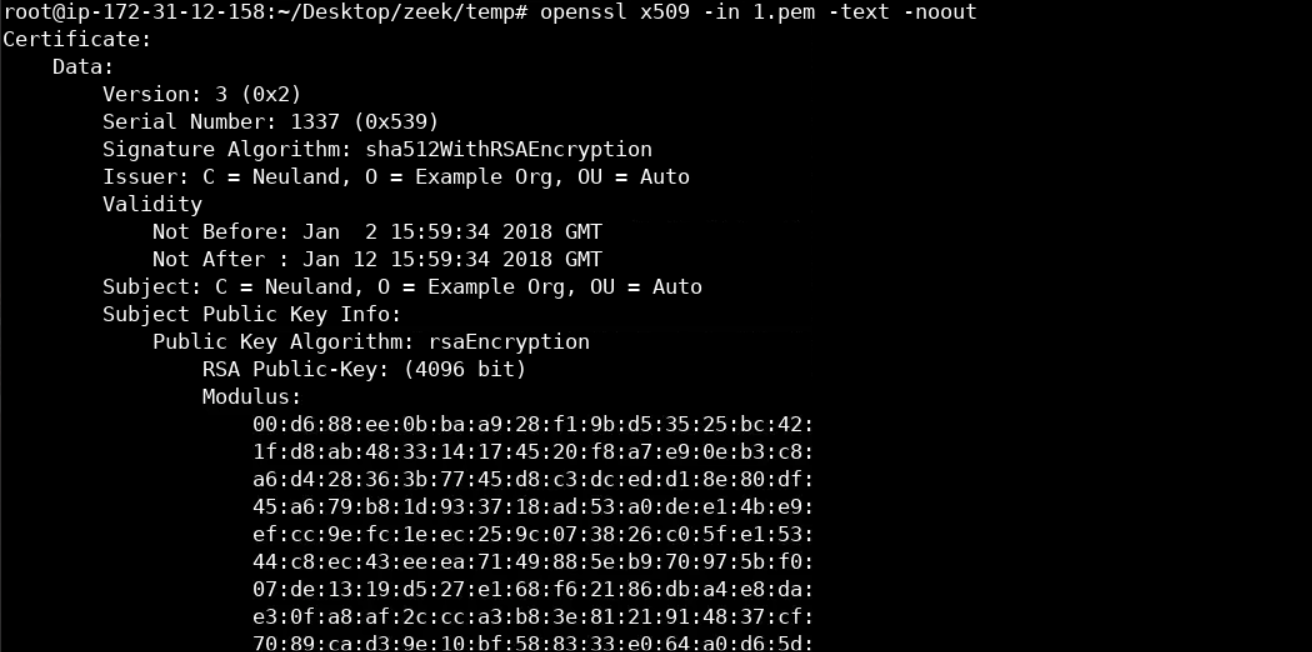
Let's continue, by inspecting 1.pem, we can do so through the openssl binary, as follows.
openssl x509 -in 1.pem -text -nooutYou should see the below.
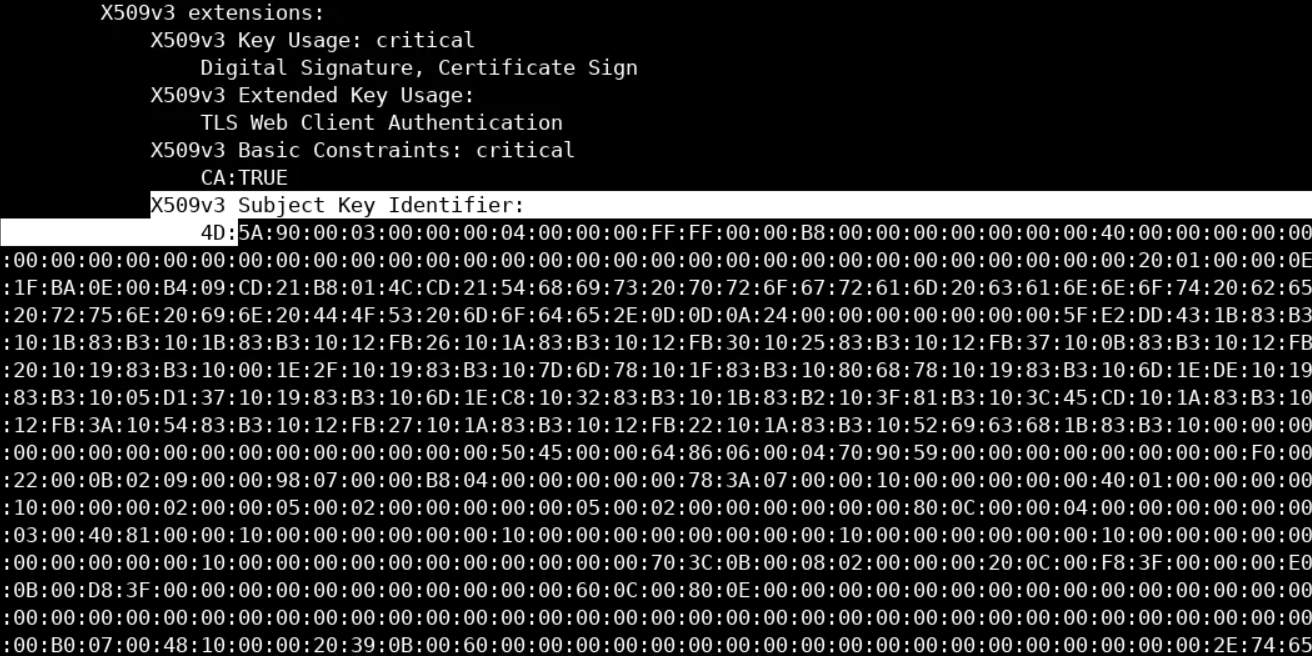 If you go further down the certificate, you will notice an overly large X509v3 Subject Key Identifier section.
Such an overly large X509v3 Subject Key Identifier and subsequently such an overly large .pem file is not common. Additionally, the whole section seems like hex values (including NULL ones) and that 4D5A part, in the beginning, looks scary because it is the equivalent of the MZ in ASCII and MZ is known to be a magic value to identify a Portable Executable file format.
Let's make sure, by executing the following.
echo "copy-paste the whole X509v3 Subject Key Identifier section here" | sed 's/://g'Then, take the stripped output and execute the following.
echo "copy-paste the stripped X509v3 Subject Key Identifier section here" | xxd -r -pYou should see the following.
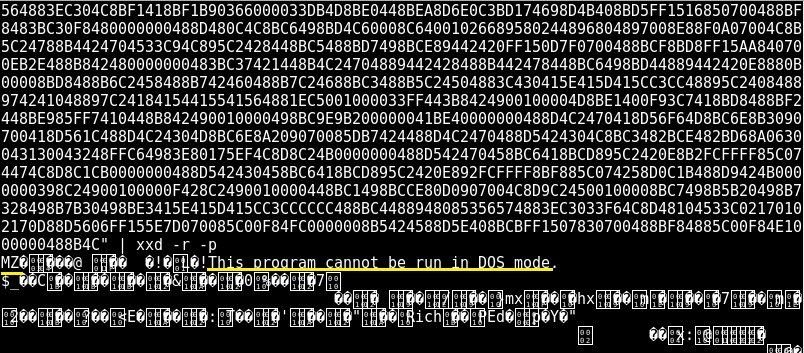
The above means that a binary was stealthily being transferred, masked as an X509v3 Subject Key Identifier.
PCAP was taken from: https://github.com/fideliscyber/x509/
For more on the attacking technique being used, check out the following link: https://www.fidelissecurity.com/threatgeek/threat-intelligence/x509-vulnerabilities>
First, delete any previously generated logs in the current directory.
Run -
cd ../..
rm -r zeek
mkdir zeek
cd zeek
Now, let's start our analysis, by executing Zeek as follows.
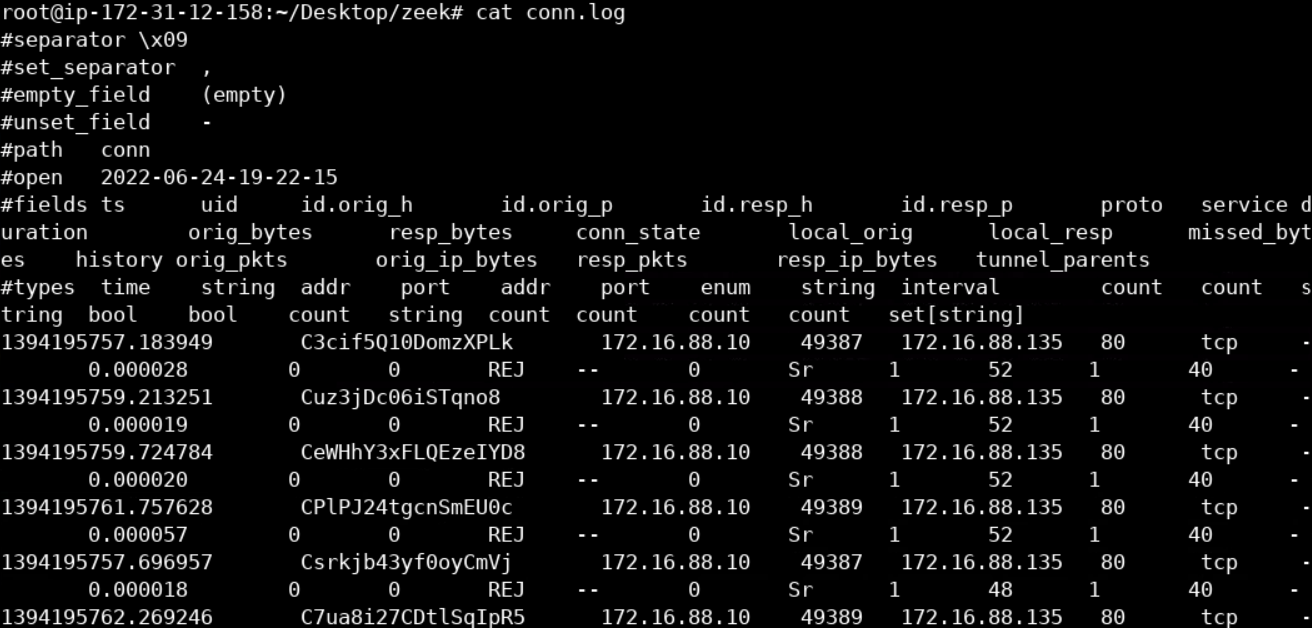
zeek -C -r /root/Desktop/PCAPs/incident_2.pcap localFor a summary of the connections in incident_2.pcap you can refer to Zeek's conn.log, as follows.
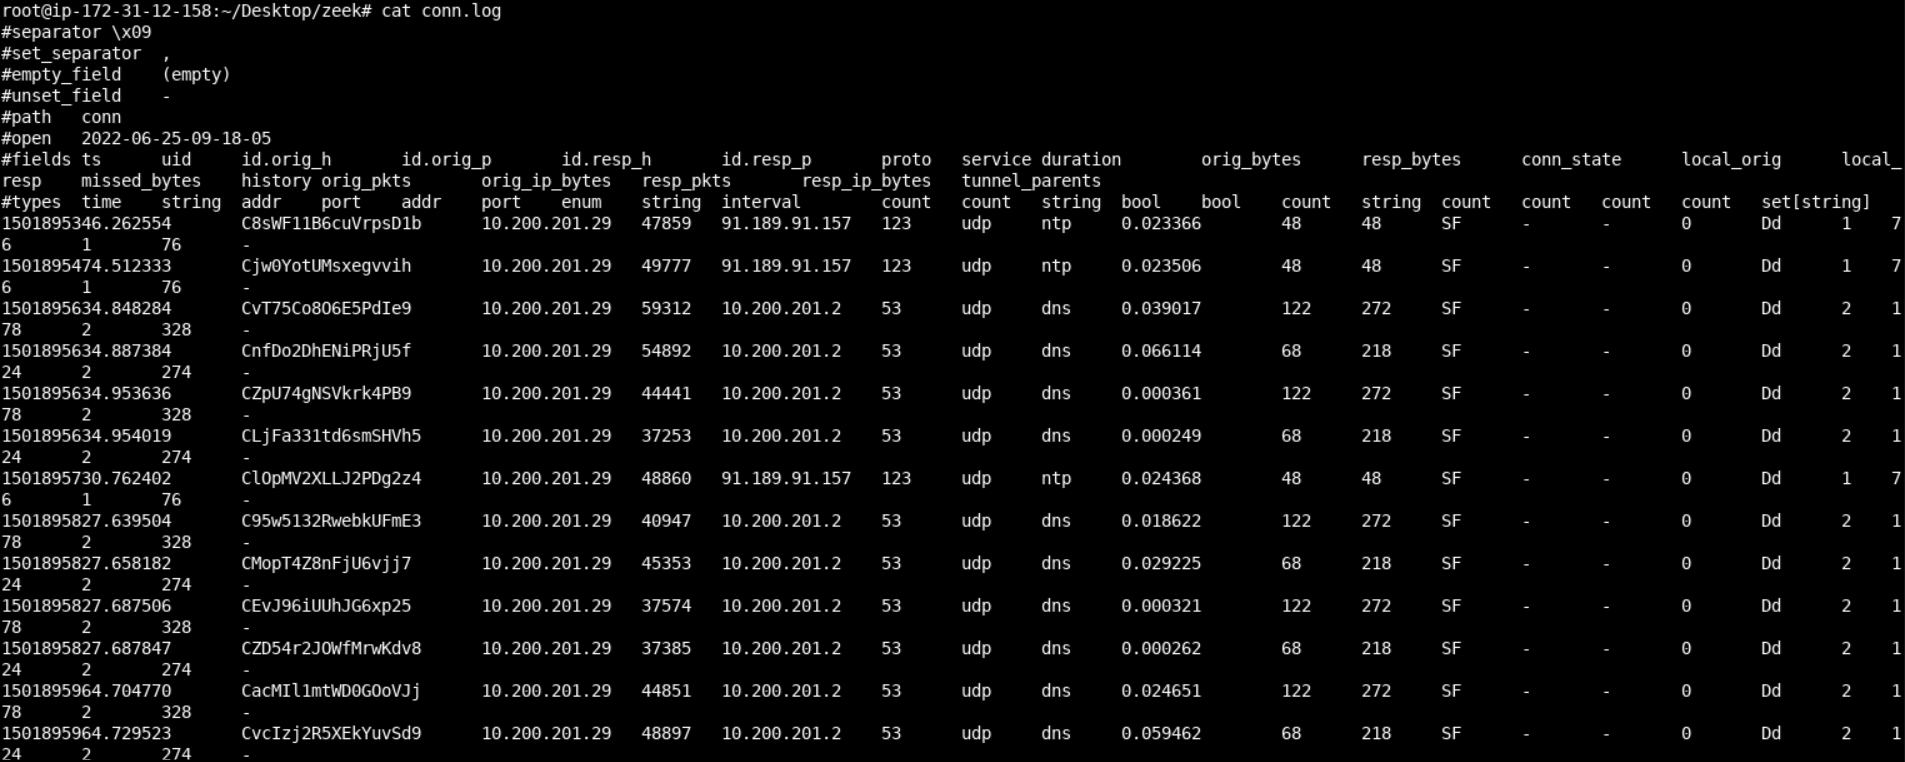
cat conn.logYou should see something similar to the below.
For a more straightforward representation, we can execute the following.
cat conn.log | zeek-cut id.orig_h id.orig_p id.resp_h id.resp_p proto conn_state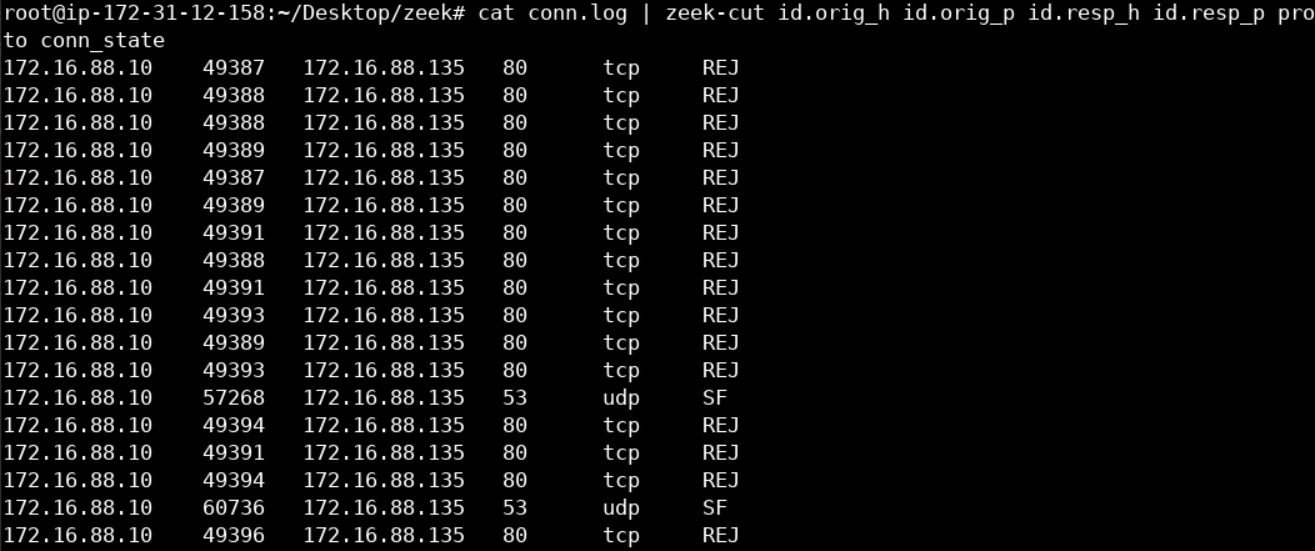
Remember that traffic was captured inside a sandbox; this is why you see some inconsistent connection attempts on port 80. Some of them got rejected (REJ), some of them had no reply (S0), and others left the connection half-open (SH).
Port 80 means that HTTP traffic occurred. Let's take a closer look by inspecting Zeek's http.log, as follows.
cat http.log | zeek-cut id.orig_h id.orig_p id.resp_h id.resp_p host uri referrerYou should see the below.
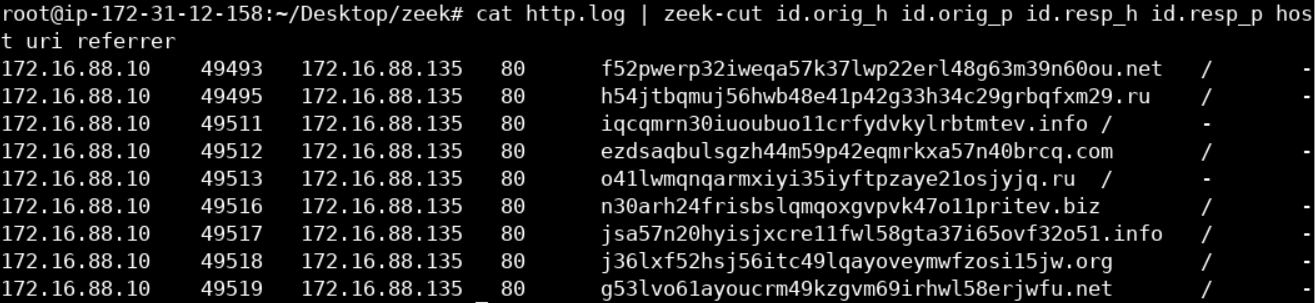
The host field looks quite abnormal.
If we take a look at zeek's dns.log, the same story continues.
cat dns.log | zeek-cut query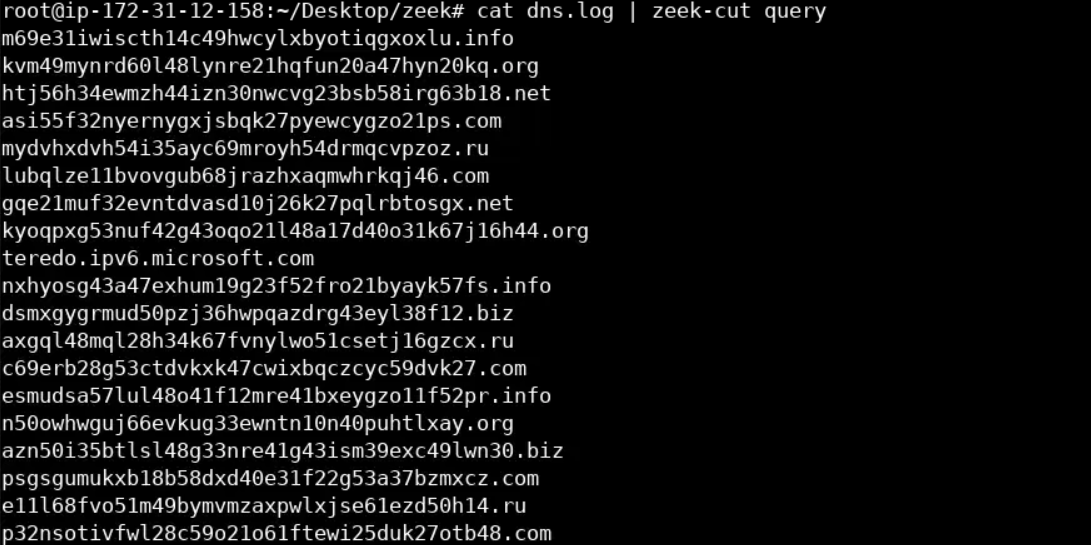
Let's now analyze the requested domains. First, let's get rid of the TLDs, as follows.
cat dns.log | zeek-cut query | cut -d . -f1 > stripped_domainsfor i in `cat stripped_domains`; do echo "${#i}"; done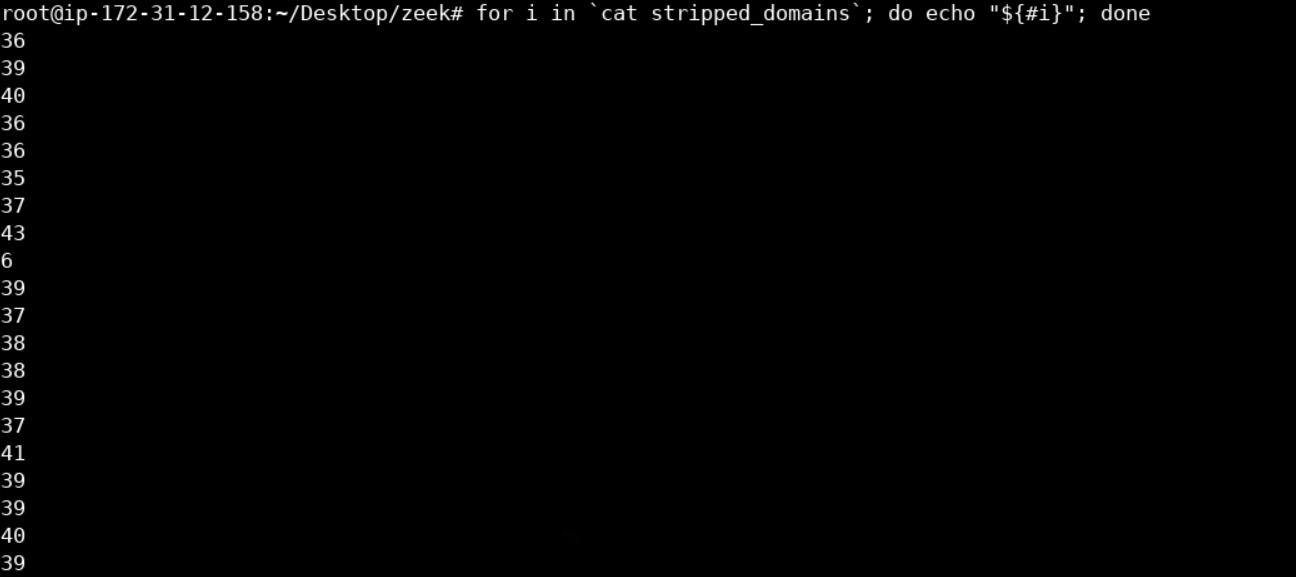
The stripped domains seems to be random strings of character between some range.
We are most probably dealing with a DGA-equipped malware.
PCAP was taken from: http://blog.opensecurityresearch.com
First, delete any previously generated logs in the current directory.
Run -
cd ..
rm -r zeek
mkdir zeek
cd zeek
Now, let's start our analysis, by executing Bro as follows.
zeek -C -r /root/Desktop/PCAPs/incident_3.pcap localFor a summary of the connections in incident_3.pcap you can refer to Zeek's conn.log, as follows.
cat conn.logYou should see the below.
We notice that Zeek identified SSL on port 80; this is quite strange.
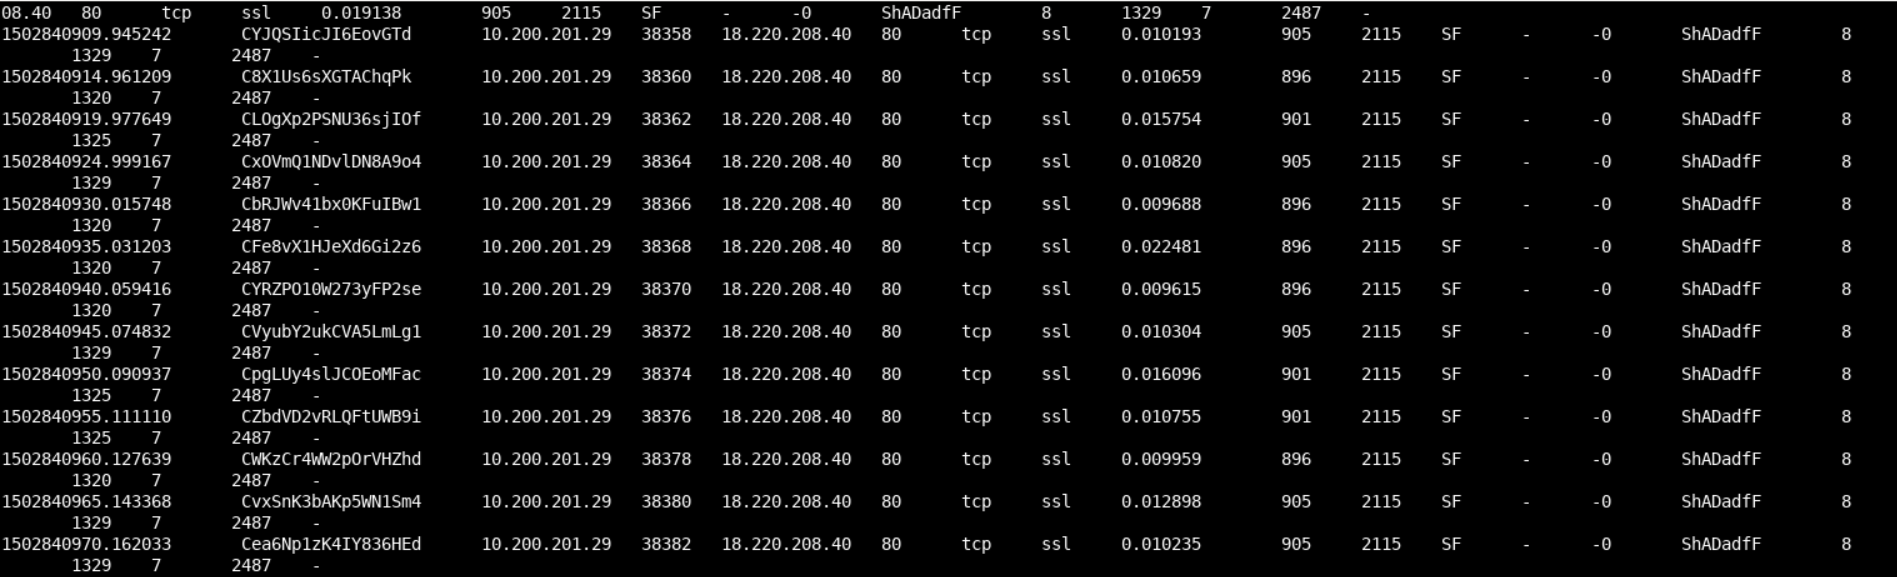
Let's take a look at Zeek's ssl.log as well.
cat ssl.logYou should see the following.
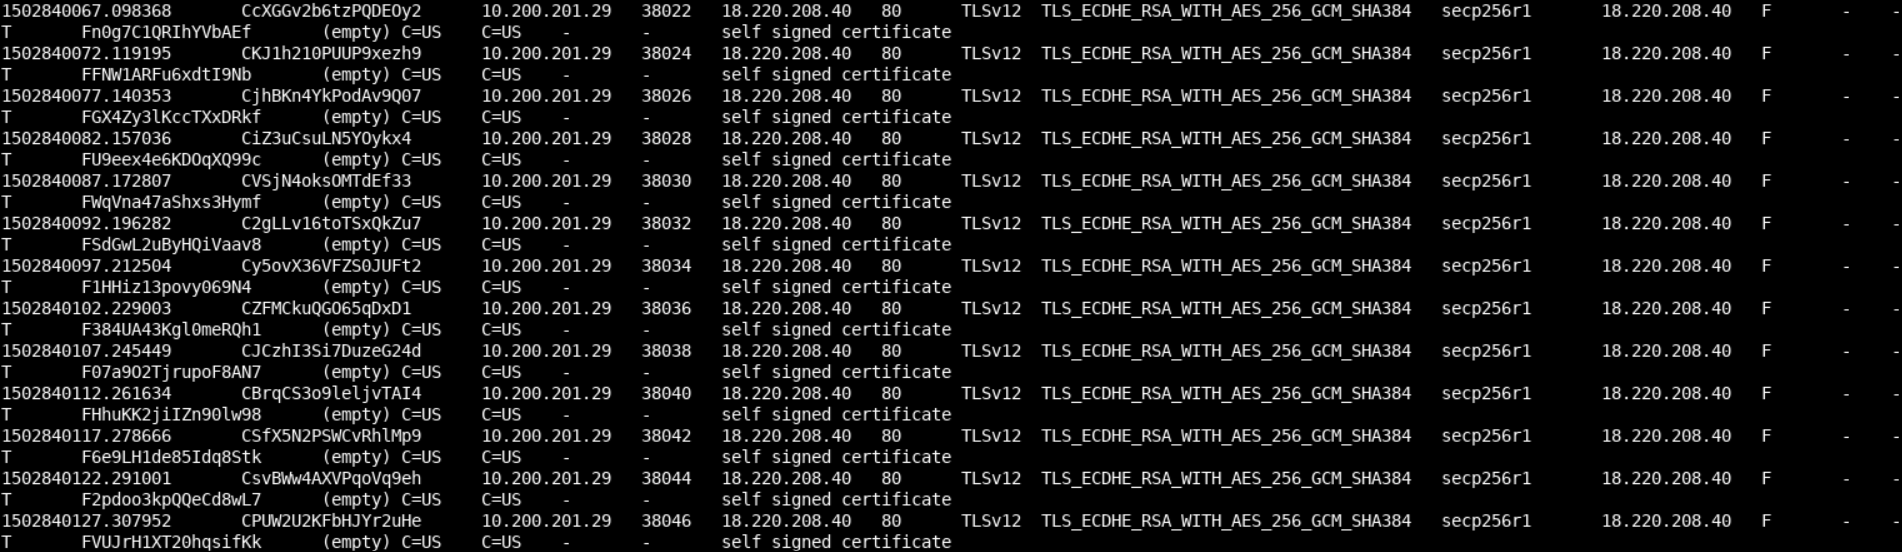
Of course, we notice the presence of self-signed SSL certificates, but this is just the tip of the iceberg. If we carefully look at the timestamps of both conn.log and ssl.log, we notice that communication with the remote server occurs every 5 seconds. We are most probably dealing with a beaconing malware.
First, delete any previously generated logs in the current directory.
Run -
cd ..
rm -r zeek
mkdir zeek
cd zeek
Now, let's start our analysis, by executing Zeek as follows.
zeek -C -r /root/Desktop/PCAPs/incident_4.pcap localFor a summary of the connections in incident_4.pcap you can refer to Zeek's conn.log, as follows.
cat conn.logYou should see the below.
Further down Zeek's conn.log, we can see that there are some long-running connections with a remote machine. Find out which, as an exercise.
A viable Zeek script to detect such long-running connections can be found below. Create it through nano and save it in current directory as detect-long-connections.zeek.
@load base/protocols/conn
@load base/utils/time
# This is probably not so great to reach into the Conn namespace..
module Conn;
export {
function set_conn_log_data_hack(c: connection)
    {
    Conn::set_conn(c, T);
    }
}
# Now onto the actual code for this script\...
module LongConnection;
export {
    redef enum Log::ID += { LOG };
    ## Aliasing vector of interval values as
    ## "Durations"
    type Durations: vector of interval;
    ##The default duration that you are locally
    ##considering a connection to be "long".
    const default_durations = Durations(10min, 30min, 1hr, 12hr, 24hrs, 3days) &redef;
    ## These are special cases for particular hosts or subnets
    ## that you may want to watch for longer or shorter
    ## durations than the default.
    const special_cases: table[subnet] of Durations = {} &redef;
}
redef record connection += {
    ##Offset of the currently watched connection duration by the long-connections script.
    long_conn_offset: count &default=0;
};
event zeek_init() &priority=5
    {
    Log::create_stream(LOG, [$columns=Conn::Info, $path="conn_long"]);
    }
function get_durations(c: connection): Durations
    {
    local check_it: Durations;
    if ( c$id$orig_h in special_cases )
        check_it = special_cases[c$id$orig_h];
    else if ( c$id$resp_h in special_cases )
        check_it = special_cases[c$id$resp_h];
    else
        check_it = default_durations;
    return check_it;
}
function long_callback(c: connection, cnt: count): interval
    {
    local check_it = get_durations(c);
    if ( c$long_conn_offset < |check_it| && c$duration >= check_it[c$long_conn_offset] )
        {
        Conn::set_conn_log_data_hack(c);
        Log::write(LongConnection::LOG, c$conn);
        local message = fmt("%s -> %s:%s remained alive for longer than %s",
                       c$id$orig_h,     c$id$resp_h,        c$id$resp_p, duration_to_mins_secs(c$duration));
    ++c$long_conn_offset;
    }
    # Keep watching if there are potentially more thresholds.
    if ( c$long_conn_offset < |check_it| )
        return check_it[c$long_conn_offset];
    else
        return -1sec;
    }
event connection_established(c: connection)
    {
    local check = get_durations(c);
    if ( |check| > 0 )
        {
        ConnPolling::watch(c, long_callback, 1, check[0]);
        }
}
Let's test the script above, as follows.
zeek -C -b -r ~/Desktop/PCAPs/incident_4.pcap detect-long-connections.zeekYou should now be able to see a new log conn_long.log created in the current directory, with the below contents.
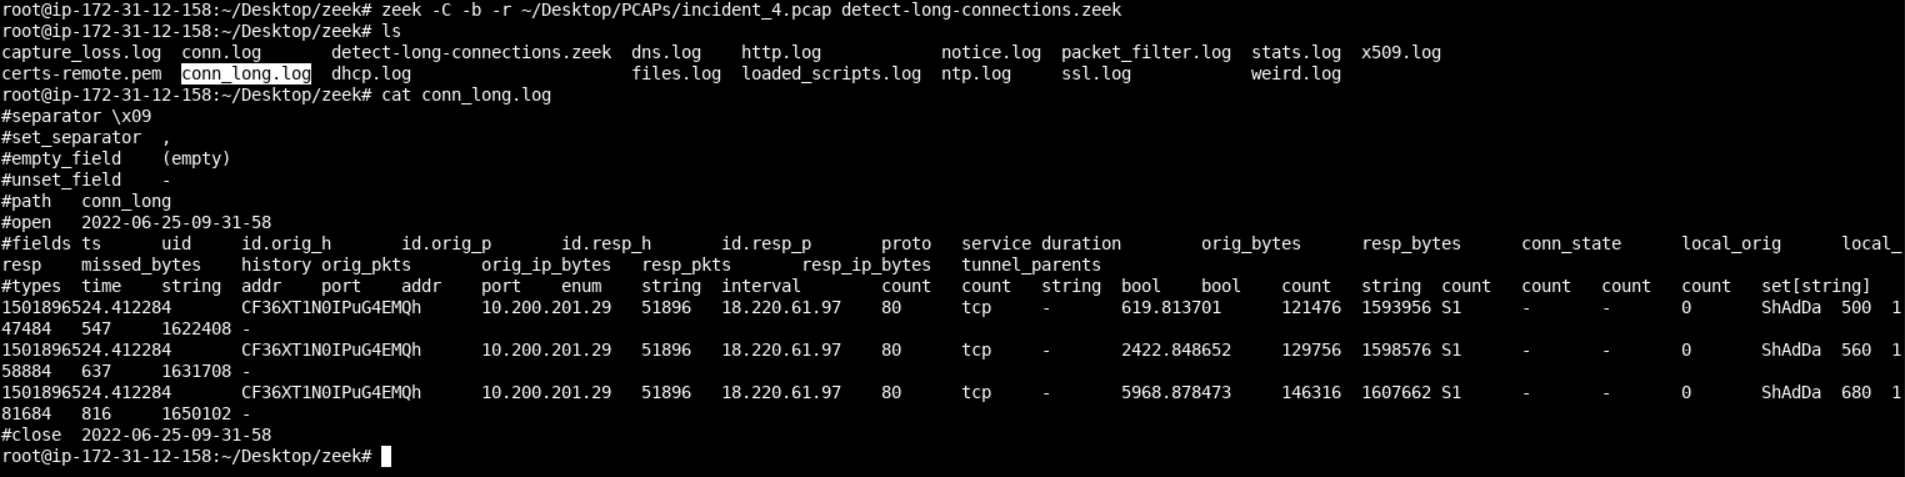
Indeed, those were the longest-running connections inside conn.log. It is way better to have a Zeek script automating this procedure for us, don't you think?
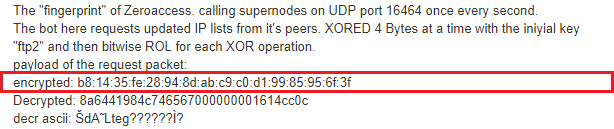
By studying the ZeroAccess analysis, we come across the following part.
First, delete any previously generated logs in the current directory.
Run -
cd ..
rm -r zeek
mkdir zeek
cd zeek
Now, we could easily make a Zeek signature based on this fingerprint, as follows.
nano zeroaccess.sigInside nano, type the following.
signature zeroaccess {
    ip-proto == udp
    payload /....\x28\x94\x8d\xab.*/
    event "zeroaccess"
}
nano zeroaccess.zeekInside nano, type the following.
@load base/frameworks/notice
@load base/frameworks/signatures/main
@load base/utils/addrs
@load base/utils/directions-and-hosts
@load-sigs ./zeroaccess.sig
redef Signatures::ignored_ids += /zeroaccess/;
module ZeroAccess;
export {
    redef enum Notice::Type += {
        ##Raised when a host doing Bitcoin mining is found.
        ZeroAccess_Client,
        ##Raised when a host is serving work to Bitcoin miners.
        ZeroAccess_Server
    };
    ##Type of ZeroAccessHost which, on discovery, should raise a notice.
    const notice_zeroaccess_hosts = LOCAL_HOSTS &redef;
    const notice_zeroaccess_hosts = LOCAL_HOSTS &redef;
    const zeroaccess_timeout = 60 mins &redef;
    global zeroaccess_tracker: set[addr];
}
event signature_match(state: signature_state, msg: string, data: string)
    &priority=-5
{
    if ( /zeroaccess/ !in state$sig_id ) return;
    if ( state$conn$id$orig_h !in zeroaccess_tracker )
    {
        add zeroaccess_tracker[state$conn$id$orig_h];
        NOTICE([$note=ZeroAccess::ZeroAccess_Client,
            $msg=fmt("Probably ZeroAccess P2P Client Access: "),
            $sub=data,
            $conn=state$conn,
            $identifier=fmt("%s%s", state$conn$id$orig_h,
state$conn$id$resp_h)]);
    }
    }
Let's now put the Zeek signature and the accompanying Zeek script to the test, as follows.
zeek -C -b -r ~/Desktop/PCAPs/ZeroAccess.pcap zeroaccess.zeekYou should now be able to find a notice.log file in the current directory, having the following content.
Run -
cat notice.log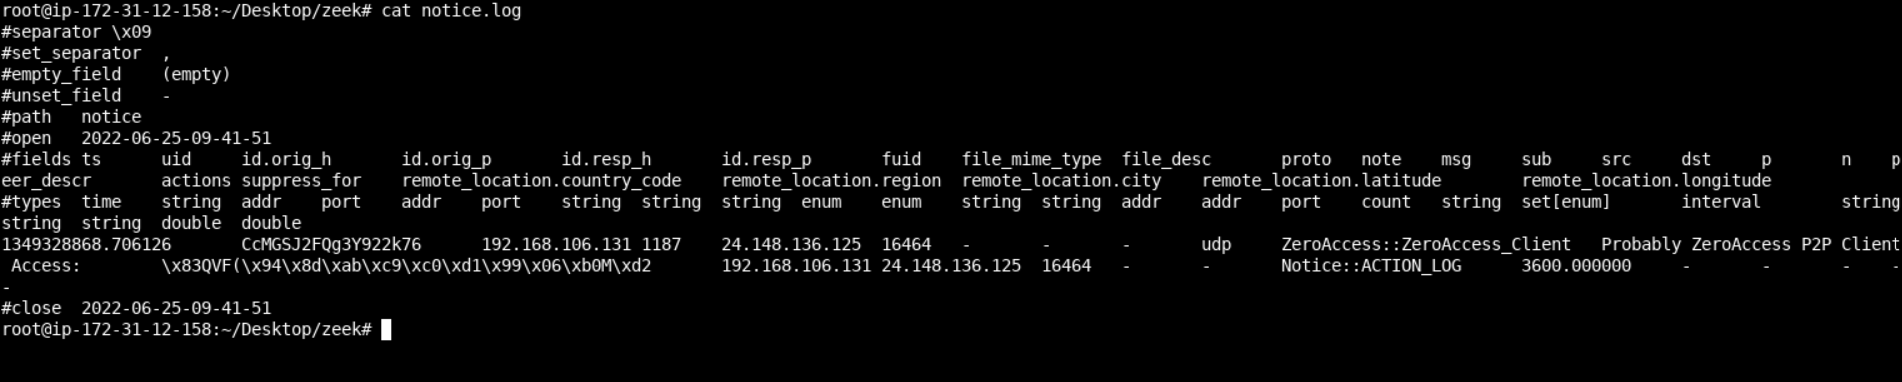
Credits to Liam Randall (Critical Stack) for the Zeek script.