Getting Started
This course assumes you are already familiar with the basics of using Ghidra, including its static analysis features. To some degree, static analysis is an integral part of debugging with Ghidra.
The specimen
Throughout this course, we will examine the provided “Terminal
Minesweeper” specimen, named termmines. If the compiled
artifact has not been provided for you, you may build it from source
using the provided Makefile, but you will
need ncurses.h first:
cd GhidraClass/ExerciseFiles/Debugger
make
The specimen is designed for Linux, but should be trivially portable
to other Unix systems. You will need ncurses and its
development headers and libraries available on your system. Though
source code for the specimen is available, we strongly encourage you to
work on the course exercises without referring to it. Symbols and debug
information are removed from the binary. With some effort,
termmines may even port to Windows; however, we have not
tested this course on Windows.
It is a good idea to get acquainted with the specimen. In general,
you should take precautions before running code you do not understand or
trust. For termmines, the risk is negligible. Run it:
./termminesYou should see a 9x9 grid and a cursor you can move with the arrow
keys. Hit Ctrl-C to exit. Probe it for help. Most Linux
programs accept a -h argument for help:
./termmines -hYou should now have all the information you need to understand how the game works. If you have never played Minesweeper before, read up online, and perhaps try playing a couple of games. Don’t get distracted, though.
Launching on Linux
On Linux, we will use GDB to debug the specimen. There are many ways to do this, but for the sake of simplicity, import and launch as follows:
Import
termminesinto a new Ghidra project.If you have a CodeBrowser open, close it and return to the main Ghidra project window.
Drag
termminesonto the Debugger in the Tool
Chest.
in the Tool
Chest.This will bring up the specimen in the Debugger tool. (If you are prompted to analyze, choose Yes.)
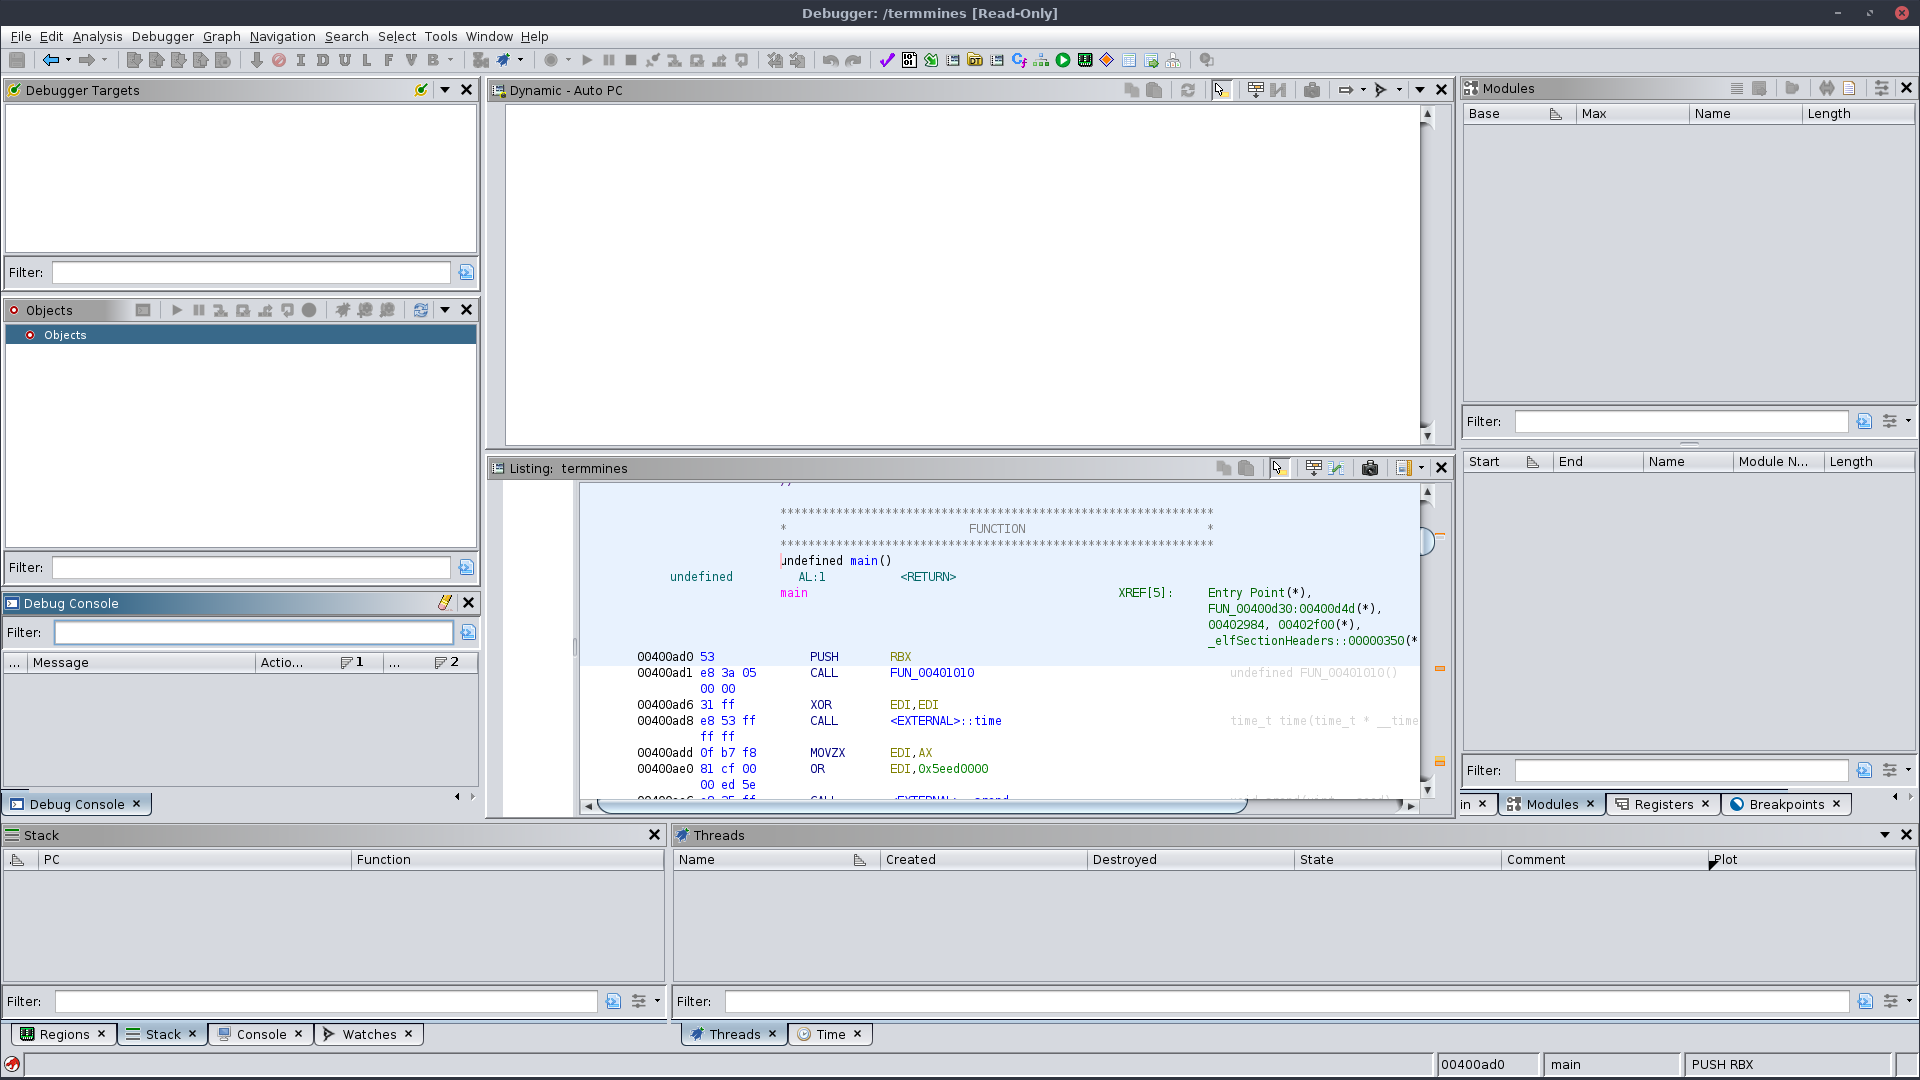
In the Debugger tool, click the dropdown ▾ for the debug
icon in the global tool
bar, and select “Debug termmines in GDB locally IN-VM.”Wait a bit then verify the Dynamic Listing window (top) is displaying disassembly code.
Launching on Windows
On Windows, we will use dbgeng to debug the specimen. This is the
engine that backs WinDbg. You may choose an alternative Minesweeper,
since terminal applications are less representative of Windows
executables. Follow the same process as for Linux, except import
termmines.exe and select “Debug termmines.exe in dbgeng
locally IN-VM.”
Launching on macOS
Unfortunately, things are not so simple on macOS. See the instructions for Building LLDB-Java Bindings. Once built, follow the same process as for Linux, except select “Debug termmines in LLDB locally IN-VM.”
Troubleshooting
I’m having trouble importing termmines
Check that termmines exists. You may need to build it
yourself using make. If it exists and you are still having
trouble, please refer to the Beginner course.
There is no Debugger icon in my Tool Chest
Double-check that you are looking at the main Ghidra Project window, not a CodeBrowser. The tool chest is the box of big icons above the list of imported programs. If it is not there, you can try importing it from the default tools:
- In the menus, select Tools → Import Default Tools
- Select “defaultTools/Debugger.tool”
- Click Import
There is no Debug / Launch icon in the global toolbar
Double-check that you are in the Debugger tool, not the CodeBrowser tool. If it is still not there, then you may need to re-import the default Debugger tool as under the previous heading. If it is still not there, your installation may be corrupt.
There is no “Debug termmines in GDB locally IN-VM” option in the launch drop-down
You may need to install GDB and/or configure Ghidra with its location. If you have a copy or custom build of GDB in a non-system path, note its full path. If you intend to use the system’s copy of GDB, then in a terminal:
which gdbNote the path given. (If you get an error, then you need to install
GDB.) In a terminal, type the full path of GDB to ensure it executes
properly. Type q to quit GDB.
- From the Debugger Targets window, click the Connect
 button.
 - In the Connect dialog, select “gdb” from the dropdown at the top.
- Enter the full path, e.g.,
/usr/bin/gdb, in the “GDB launch command” field. - Click “Connect”
- If you get an Interpreter window, then things have gone well.
- Type
echo testinto it to verify it’s responsive, then typeqto disconnect. - Close the Debugger tool, then retry.
The launch hangs for several seconds and then prompt for a “recorder”
You probably have a stale GDB connection, so when you launched you now have multiple connections. For the prompt, select the option with the highest score. Examine the Targets window to confirm you have multiple GDB connections. If you know which is the stale connection, you can right-click it and choose Disconnect. Otherwise, use Disconnect All from the drop-down menu and re-launch.
The Dynamic Listing is empty
Check for an actual connection. You should see an entry in the Debugger Targets window, a populated Object window, and there should be an Interpreter window. If not, then your GDB connector may not be configured properly. Try the steps under the previous heading.
If you have an Interpreter window, there are several possibilities:
Ghidra or GDB failed to launch the target:
Check that the original termmines exists and is
executable. It must be at the path from where it was originally
imported. If you imported from a share, consider copying it locally,
setting its permissions, then re-importing.
The target was launched, but immediately terminated:
Check that the specimen has a main symbol. NOTE: It is
not sufficient to place a main label in Ghidra. The
original file must have a main symbol.
Alternatively, in the menus try Debugger → Debug termmines →
in GDB locally IN-VM, and select “Use starti.” This will break
at the system entry point. If you have labeled main in
Ghidra, then you can place a breakpoint there and continue — these
features are covered later in the course.
Alternatively, try debugging the target in GDB from a separate terminal completely outside of Ghidra to see if things work as expected.
The target was launched, but has not stopped, yet
Try pressing the Interrupt  button. If that doesn’t work or is
unsatisfactory, try the remedies under the previous heading — for an
immediately terminating target.
button. If that doesn’t work or is
unsatisfactory, try the remedies under the previous heading — for an
immediately terminating target.
You hit an uncommon bug where the memory map is not applied properly
This is the case if the Dynamic Listing is completely blank but the
Regions window is replete. The Dynamic Listing just needs to be kicked a
little. The easiest way is to step once, using the  Step Into button in the
main toolbar. If this is not desirable, then you can toggle
Force Full View back and forth. In the Regions window,
use the drop-down menu to toggle it on, then toggle it off. The Dynamic
Listing should now be populated. To go to the program counter,
double-click the “pc = …” label in the top right.
Step Into button in the
main toolbar. If this is not desirable, then you can toggle
Force Full View back and forth. In the Regions window,
use the drop-down menu to toggle it on, then toggle it off. The Dynamic
Listing should now be populated. To go to the program counter,
double-click the “pc = …” label in the top right.
Something else has gone wrong
Try typing info inferiors and similar GDB diagnostic
commands into the Interpreter.
The listings are in sync, but the Dynamic Listing is grey 00s
Check the Auto-Read drop-down near the top right of the Dynamic Listing. It should be set to Read Visible Memory, RO Once.
Exercise: Launch termmines
If you were following along with an instructor, delete your import of
termmines and/or start a new Ghidra Project. Starting from
the beginning, import termmines and launch it in the Ghidra
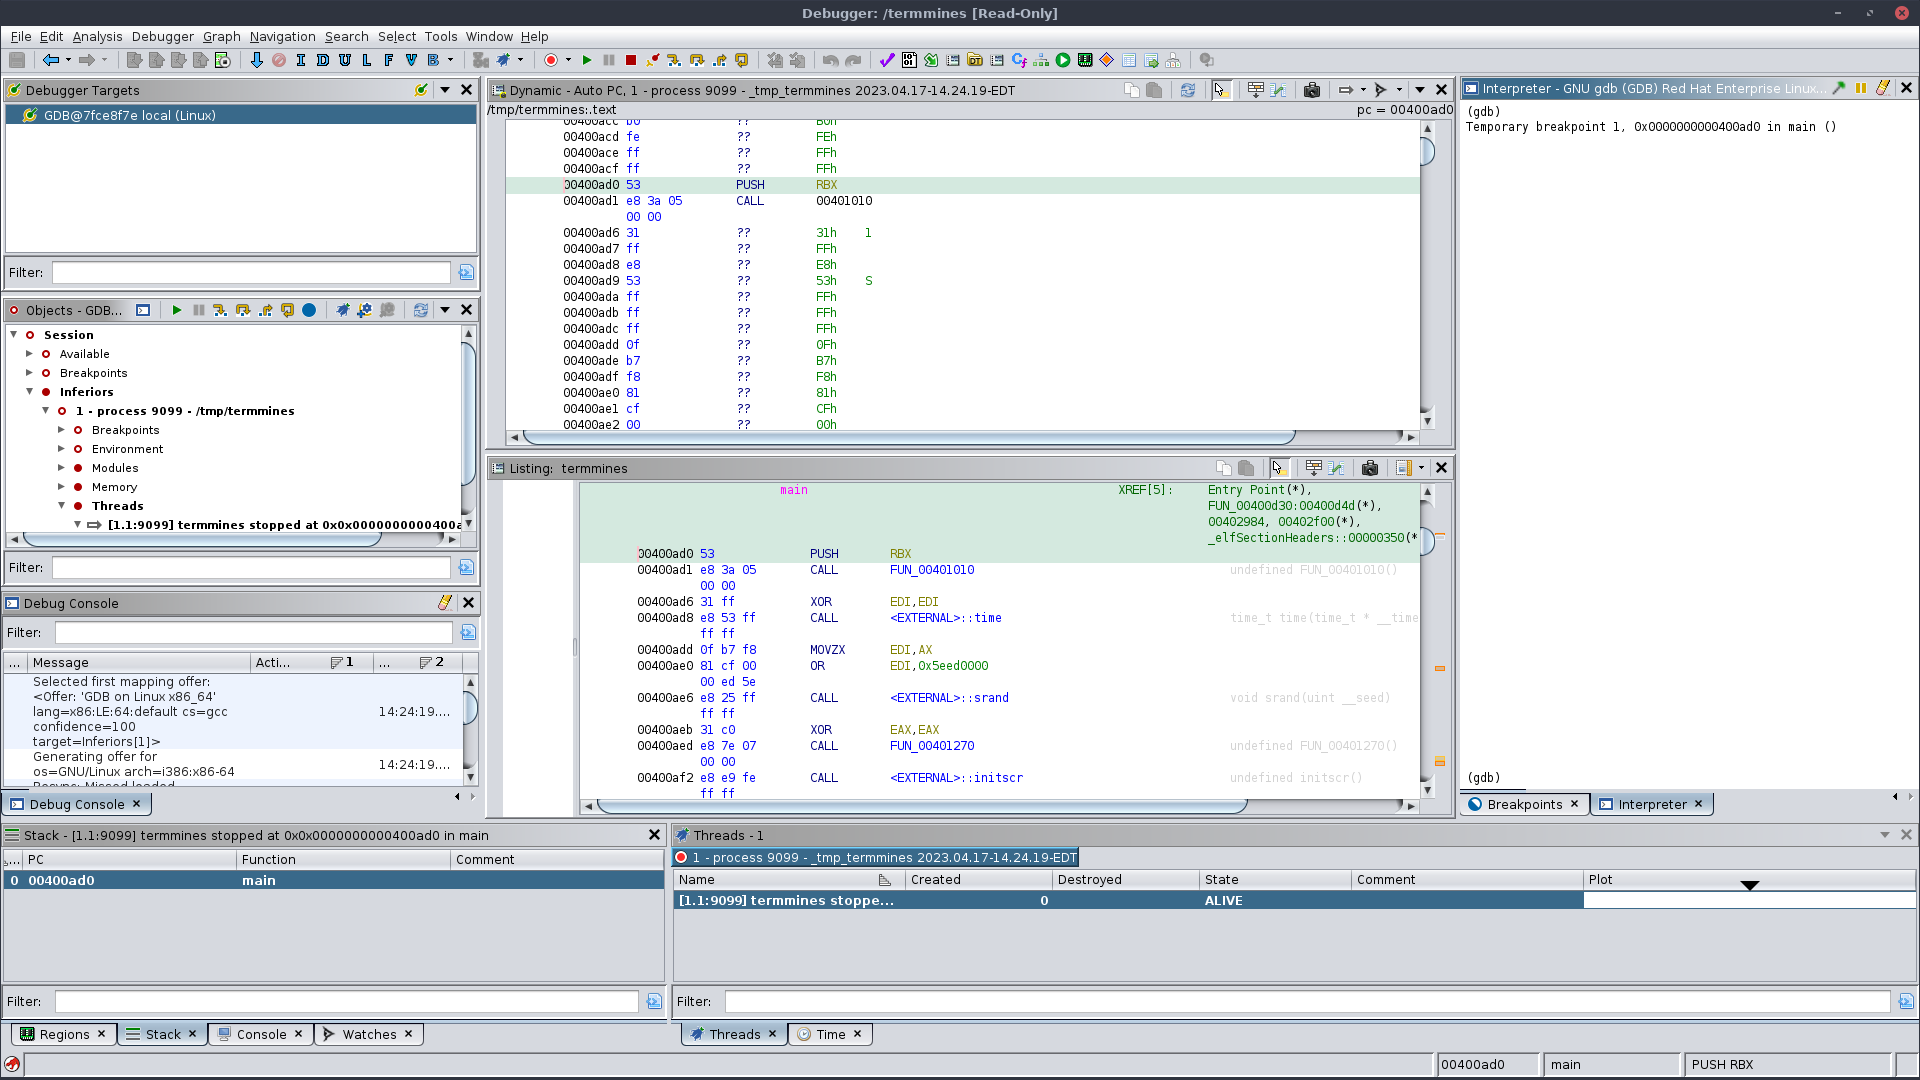
Debugger with GDB. When your tool looks like the screenshot with a
populated Dynamic Listing, you have completed the exercise. Disconnect
before proceeding to the next exercise.
Customized Launching
For this specimen, you may occasionally need to provide custom command-line parameters. By default, Ghidra attempts to launch the target without any parameters. In the menus, use Debugger → Debug termmmines → in GDB locally IN-VM to launch with customizations. Ghidra will remember these customizations the next time you launch using the drop-down button from the toolbar. The first dialog allows you to customize the connection to the back-end debugger. Unless you have a special copy of GDB, you should probably just click Connect. The second dialog allows you to customize how the back-end debugger launches the target. This is where you tweak the command line. You can also change the actual image, in case it has moved or you want to experiment with a patched version.
Exercise: Launch with Command-line Help
Launch the specimen so that it prints its usage. When successful, you will see the usage info in the Debugger’s Interpreter window. NOTE: The process will terminate after printing its usage, and as a result, the rest of the UI will be mostly empty.
Attaching
Attaching is slightly more advanced, but because the target will need to read from stdin, and Ghidra does not properly attach the Interpreter to stdin, we will need to launch the target in a terminal and attach to it instead. Note this technique is only possible because the target waits for input. Depending on the task for future exercises, you may still need to launch from the Debugger instead of attaching.
- Run
termminesin a proper terminal with the desired command-line parameters. - In the Ghidra Debugger, find the Targets window, and click the Connect button.
- Select “gdb” from the drop-down box.
- This dialog should look familiar from the Customized Launching section. Just click the Connect button.
- In the Objects window (below the Targets window), expand the node labeled “Available.”
- In the filter box, type
termmines. - Right-click on the termmines process and select Attach. If this
fails, select Available again, and click the
 Refresh
button.
Refresh
button.
Exercise: Attach
Try attaching on your own, if you have not already. Check your work
by typing bt into the Interpreter. If you are in
read you have completed this exercise. Disconnect before
proceeding to the next module: A Tour of the
UI
Troubleshooting
If you get Operation not permitted or similar when
trying to attach, it is likely your Linux system is configured with
Yama’s ptrace_scope=1. We have provided a stub utility
called anyptracer. The utility permits its own process to
be traced by any other process and then executes a shell command. Using
exec as that shell command enables you to execute the
specimen in the permissive process, and thus you can attach to it as if
ptrace_scope=0, but without reducing the security of the
rest of the system. For example:
./anyptracer 'exec ./termmines'Alternatively, if you have root access, you can rectify the issue using the relevant documentation available online. Beware! You should not modify this setting on your daily driver, as this substantially reduces the security of your system. Any compromised process would be allowed to attach to and steal data, e.g., credentials, from any other process owned by the same user.