Using Breakpoints
This module assumes you know how to launch termmines in
Ghidra using GDB and know where to find the basic Debugger GUI
components. If not, please refer to the previous modules.
This module will address the Breakpoints window in more depth. While the breakpoint manager is able to deal with a system of targets, we will only deal with a single target at a time.
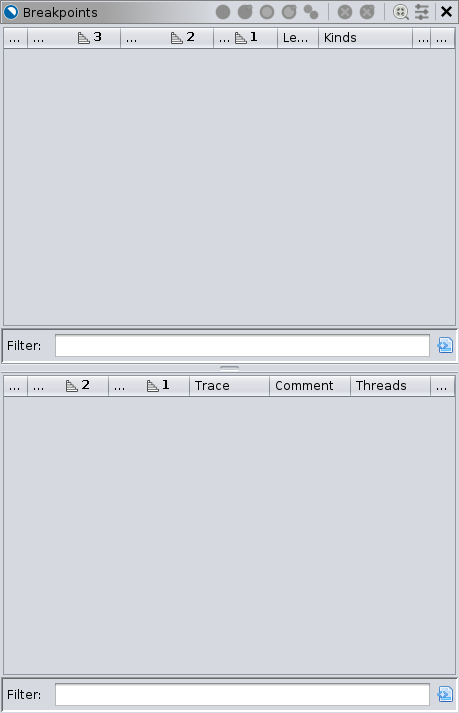
Breakpoints
Most likely, this window is empty if you have been following the lesson.
From here, you can toggle and delete existing breakpoints. There are several ways to set a new breakpoint:
- From any static or dynamic listing window, including Disassembly,
Memory/Hex, and the Decompiler, right-click and select
 Set
Breakpoint, press K on the keyboard, or double-click
the margin.
Set
Breakpoint, press K on the keyboard, or double-click
the margin. - From the Objects window click the Add
Breakpoint button or press F3 on the keyboard.
- From the Interpreter window, use the GDB command, e.g.,
break main.
The advantage of using the listings is that you can quickly set a
breakpoint at any address. The advantage of using the Objects or
Interpreter window is that you can specify something other than an
address. Often, those specifications still resolve to addresses, and
Ghidra will display them. Ghidra will memorize breakpoints by recording
them as special bookmarks in the imported program. There is some
iconography to communicate the various states of a breakpoint. When all
is well and normal, you should only see enabled and
disabled  breakpoints. If the target is terminated
(or not launched yet), you may also see ineffective
breakpoints. If the target is terminated
(or not launched yet), you may also see ineffective  breakpoints.
Examining Minesweeper Board Setup
Suppose we want to cheat at termmines. We might like to
understand how the mines are placed. Knowing that the mines are placed
randomly, we might hypothesize that it is using the srand
and rand functions from the C standard library. While we
can test that hypothesis by examining the imports statically, we might
also like to record some actual values, so we will approach this
dynamically. (This is the Debugger course, after all.) The breakpoint on
srand will allow us to capture the random seed. The
breakpoint on rand will help us find the algorithm that
places the mines.
Set the Breakpoints
In the Interpreter, type the GDB commands to set breakpoints on
srand and rand:
break srand
break rand
The breakpoint window should now be updated:
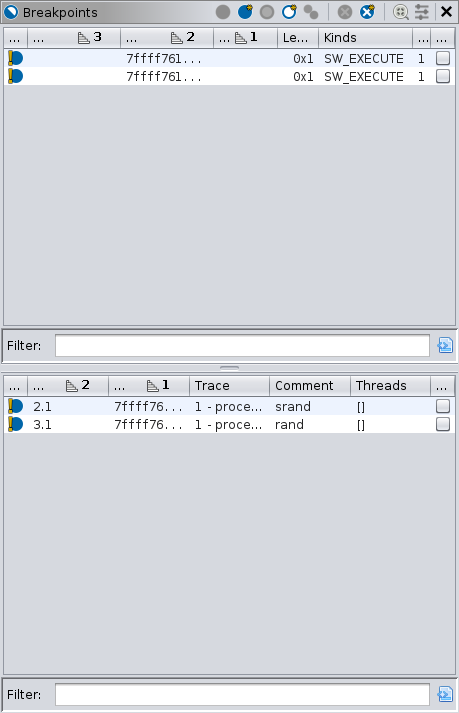
For a single target, the lower panel of the Breakpoints window does not add much information, but it does have some. We will start with the top panel. This lists the “logical” breakpoints, preferring static addresses.
- The left-most column Enabled indicates the
breakpoint’s state. Here, we see the inconsistent
 overlay, because Ghidra cannot save the breakpoint without a module
image. That is because
overlay, because Ghidra cannot save the breakpoint without a module
image. That is because srandandrandare in a different module, and we have not yet imported it into Ghidra. - The next column Name is the name of the breakpoint. This is for informational purposes only. You can rename a breakpoint however you like, and it will have no effect on the target nor back-end debugger.
- The next column Address gives the address of the breakpoint. Notice that the addresses were resolved, even though the breakpoints were specified by symbol. Typically, this is the static address of the breakpoint; however, if the module image is not imported, yet, this will be the dynamic address, subject to relocation or ASLR.
- The next column Image gives the name of the imported image containing the breakpoint. Again, because the module has not been imported yet, this column is blank.
- The next column Length gives the length of the breakpoint. In GDB, this generally applies to watchpoints only.
- The next column Kinds gives the kinds of
breakpoint. Most breakpoints are software execution breakpoints,
indicated by “SW_EXECUTE.” That is, they are implemented by patching the
target’s memory with a special instruction (
INT3on x86) that traps execution. There are also hardware execution breakpoints indicated by “HW_EXECUTE,” and access breakpoints indicated by “HW_READ” and/or “HW_WRITE”. NOTE: GDB would call these “watchpoints.” An advantage to software breakpoints is that you can have a practically unlimited number of them. Some disadvantages are they can be detected easily, and they are limited to execution breakpoints. - The next column Locations counts the number of locations for the breakpoint. For a single-target session, this should always be 1.
- The final column Sleigh is only applicable to the emulator. It indicates that the breakpoint’s behavior has been customized with Sleigh code. This is covered in Emulation.
Now, we move to the bottom panel. This lists the breakpoint locations, as reported by the back-end debugger(s). The Enabled, Address, and Sleigh columns are the same as the top, but for the individual dynamic addresses.
- The Name column is the name as designated by the back-end.
- The Trace column indicates which target contains the location. The text here should match one of the tabs from the Threads panel.
- The Comment column is a user-defined comment. Its
default value is the specification that generated it, e.g.,
srand. - The Threads column indicates if the breakpoint is scoped to a limited set of threads. Its use is atypical.
Toggling the Breakpoints
While there is no need to toggle the breakpoints right now, it is a good time to demonstrate the feature. There are several ways to toggle a breakpoint:
- In any listing, as in setting a breakpoint, right-click and select a toggle action, press K on the keyboard, or double-click its icon in the margin.
- From the Objects window, expand the Breakpoints node, right-click a breakpoint and select Toggle or press T on the keyboard.
- From the Breakpoints window, single-click the breakpoint’s status icon, right-click an entry and select a toggle action, or create a selection and use a toggling action from the local toolbar. Either panel works, but the top panel is preferred to keep the breakpoints consistent. The local toolbar also has actions for toggling all breakpoints in the session.
- From the Interpreter window, use the GDB commands, e.g.,
disable 2.
Practice toggling them. Notice that no matter how you toggle the
breakpoints, the display updates. You might also type
info break into the Interpreter to confirm the effect of
toggling breakpoints in the GUI. When you are finished, ensure both
breakpoints are enabled.
Importing libc
While the Debugger can operate without importing external modules, it
generally works better when you have. The symbols srand and
rand are in libc. If you would like to save
the breakpoints we placed on them, you must import the module. You could
do this in the usual manner, but the Debugger offers a convenient way to
import missing modules.
Navigate to a dynamic address that would be mapped to the missing module. For our scenario, the easiest way to do that is to double-click an address in the Breakpoints window. Either one points somewhere in
libc.Check the Debug Console window for a note about the missing module:
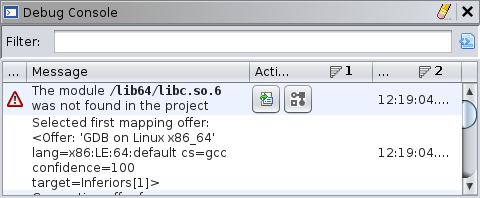
Click the import button — leftmost of the remedial actions. It will display a file browser pointed at the library file.
Proceed with the import and initial analysis as you would in the CodeBrowser.
Once imported, the Breakpoints window should update to reflect the
static addresses, the breakpoints should become consistent, and the
Static Listing should now be synchronized when navigating within
libc.
Capturing the Random Seed
We can now allow termmines to execute, expecting it to
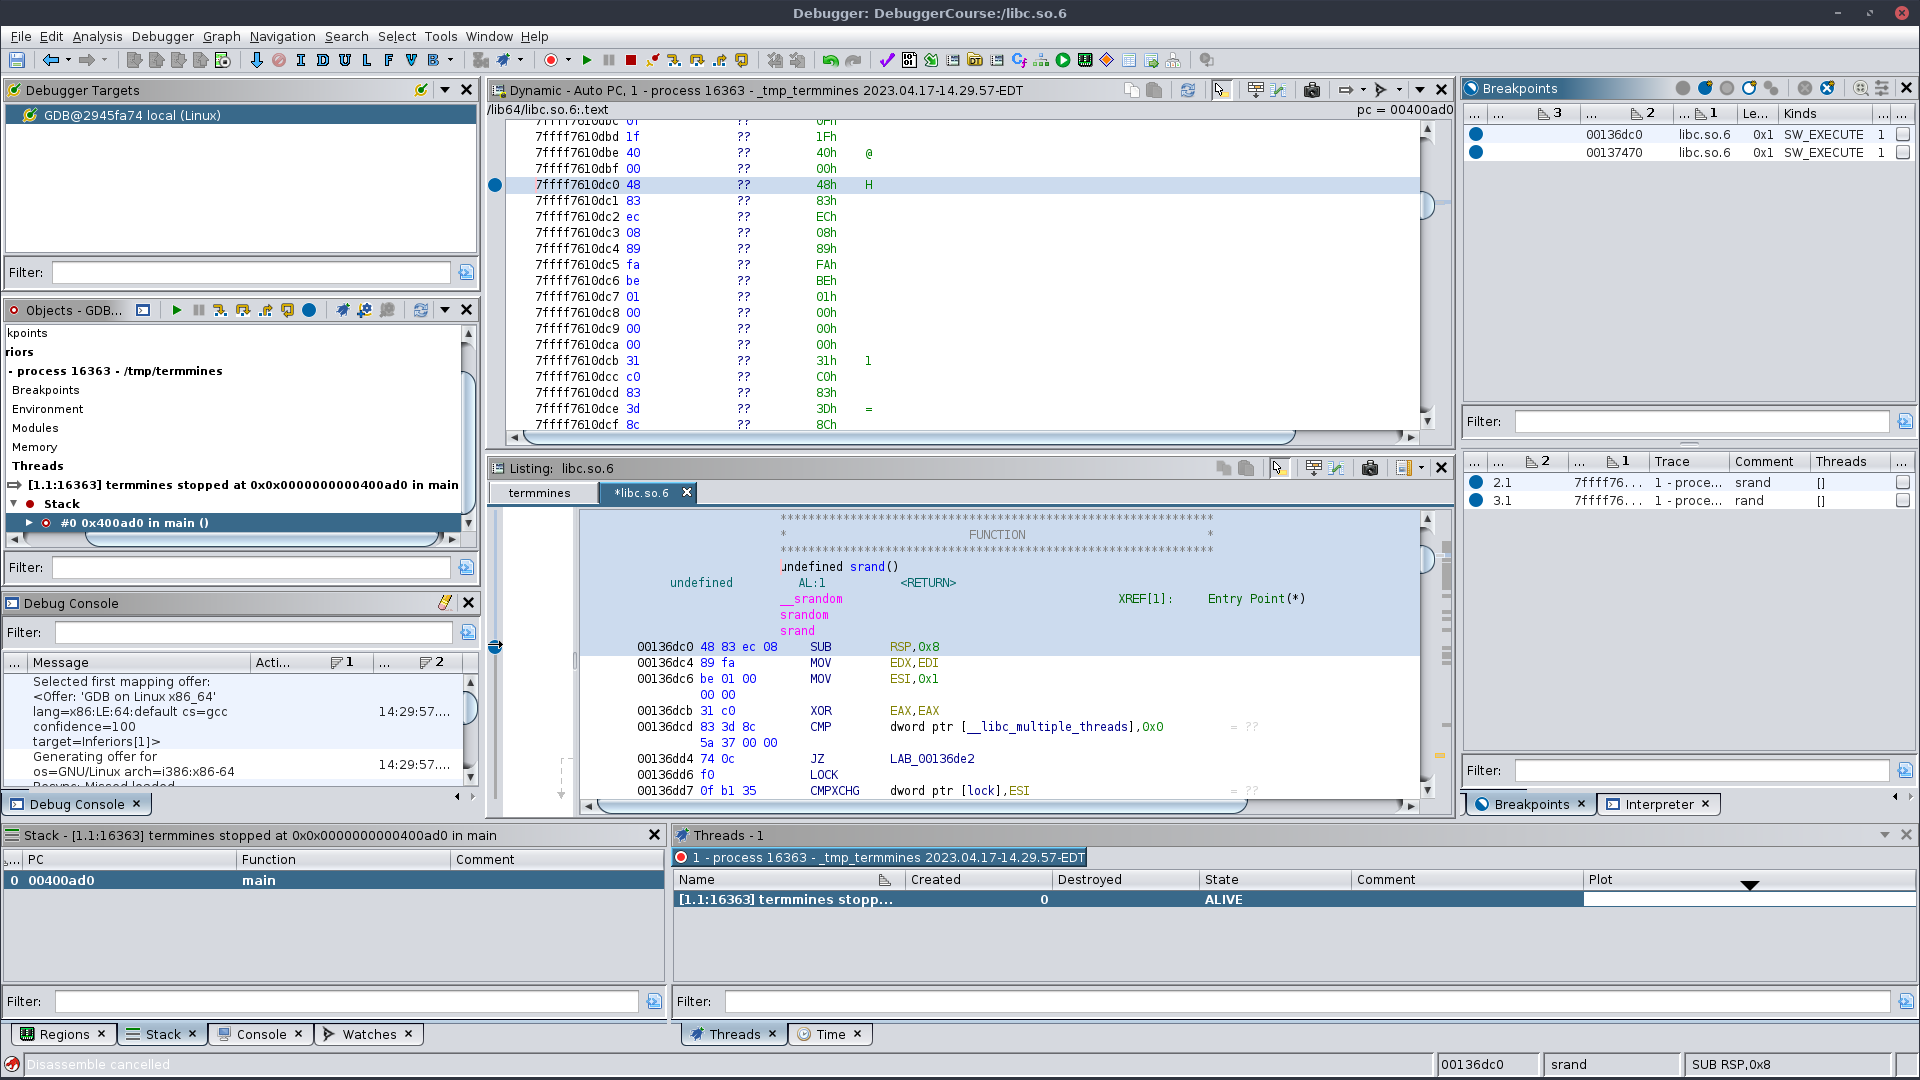
hit the srand breakpoint first. Click  Resume. If all goes well, the
target should break at
Resume. If all goes well, the
target should break at srand. If you have never written
code that uses srand before, you should briefly read its
manual page. It takes a single parameter, the desired seed. That
parameter contains the seed this very moment! We can then examine the
value of the seed by hovering over param_1 in the
decompiler.
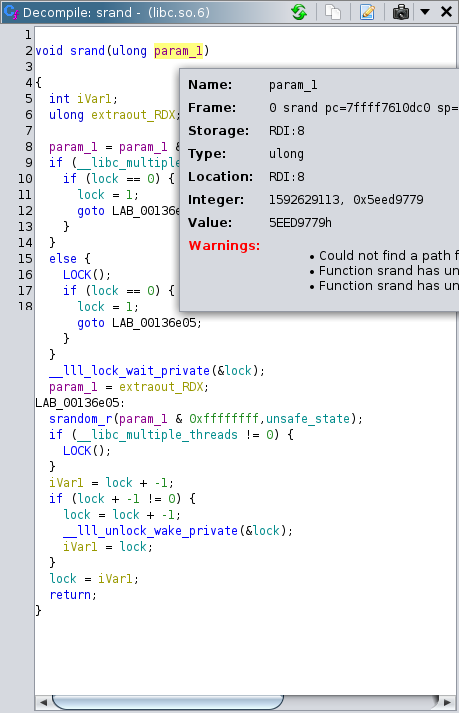
We will cover other ways to examine memory and registers in the Machine State module. We have contrived
termmines so that its random seed will always start with
0x5eed____. If you see that in the value displayed, then
you have successfully recovered the seed. This seed will be used in an
optional exercise at the end of this module. You might write it down;
however, if you re-launch termmines between now and then,
you will have a different seed.
Locating the Mine Placement Algorithm
Press Resume again. This
time, the target should break at rand. We are not
interested in the rand function itself, but rather how the
placement algorithm is using it. Press  Step Out to allow the target to return from
rand. If you still have the Decompiler up, you should be in
a code block resembling:
while (iVar2 = DAT_00604164, iVar1 = DAT_00604160, iVar10 < _DAT_00604168) {
  iVar3 = rand();
  iVar2 = DAT_00604164;
  iVar11 = rand();
  lVar7 = (long)(iVar11 % iVar2 + 1) * 0x20 + (long)(iVar3 % iVar1 + 1);
  bVar14 = *(byte *)((long)&DAT_00604160 + lVar7 + 0x1c);
  if (-1 < (char)bVar14) {
    iVar10 = iVar10 + 1;
    *(byte *)((long)&DAT_00604160 + lVar7 + 0x1c) = bVar14 | 0x80;
  }
}
If you are thinking, “I could have just found rand in
the symbol table and followed its XRefs,” you are correct. However, it
is useful to use a dynamic debugging session to drive your analysis
chronologically through execution of the target, even if much of that
analysis is still static. The advantages of a dynamic session along side
static analysis should become more apparent as you progress through this
course.
Exercise: Diagram the Mines
You goal is to capture the location of all the mines. So that you can
check your work later, you should run termmines in a
terminal and attach to it from Ghidra. You will probably want to disable
the breakpoints on rand and srand for now.
Devise a strategy using breakpoints and the control buttons (Step,
Resume, etc.) so that you can observe the location of each mine. Use pen
and paper to draw a diagram of the board, and mark the location of each
mine as you observe the algorithm placing it. There should only be 10
mines in Beginner mode. Once the mines are placed, press Resume. Check you work by
winning the game. Alternatively, you can intentionally lose to have the
game reveal the mines.
Optional Exercise: Replicate the Boards (Forward Engineering)
You will need a C development environment for this exercise. Because,
as we have now confirmed, termmines is importing its random
number generator from the system, we can write a program that uses that
same generator. Further, because we can capture the seed, and we know
the placement algorithm, we can perfectly replicate the sequence of game
boards for any termmines session.
Write a program that takes a seed from the user and prints a diagram
of the first game board with the mines indicated. Optionally, have it
print each subsequent game board when the user presses ENTER. Check your
work by re-launching termmines (see note about attaching
below), capturing its seed, inputting it into your program, and then
winning the game. Optionally, win 2 more games in the same session.
NOTE: We will need a more advanced attaching
technique to check your work, because you will need both to break on
srand (which happens early in the process’ execution,
ruling out our usual attach technique) and to interact with it in the
terminal (which rules out launching in Ghidra). There are a few ways
around this, including using gdbserver or using
set inferior-tty. If you are already familiar with those,
you can try one. The technique we recommend here is using a stub that
will suspend itself and then execute termmines. We can then
run the stub in a terminal outside of Ghidra, attach to that stub, and
then allow it to proceed into termmines. In this way, we
can attach to the process in the terminal before it reaches
srand. The stub is fairly easy to write in Bash and should
be similar in other shells.
In a terminal running Bash (see note if you’re using
anyptracer):(echo $BASHPID; kill -SIGSTOP $BASHPID; exec ./termmines)The parentheses will start
bashin a new subprocess. The first two commands cause it to print its own process ID and then suspend itself. Your terminal should display the PID and report the stopped process.NOTE: If you need to use the
anyptracerstub, then the invocation is more complicated:./anyptracer 'exec bash -c "echo $BASHPID; kill -SIGSTOP $BASHPID; exec ./termmines"'In principle, it works the same except wrapped in the
anyptracerstub. The parentheses are no longer needed, nor allowed, sinceanyptraceris already a subprocess of your shell. If you include parentheses, you will get a second sub-subprocess to which you cannot attach.In Ghidra, follow the usual steps to attach, but use the PID printed in your terminal. NOTE: The process is still technically running
bashwhen you attach to it.In the Interpreter panel:
break mainNOTE: At this point
maintechnically refers to the symbol inbash, but GDB will adjust its location once the target loadstermmines.Back in your terminal running Bash:
fgThis will cause Bash to return the stub to the foreground of the terminal. Without this step, the system will repeatedly suspend the process whenever it attempts any I/O on that terminal.
In Ghidra, press Resume (or use
continuein the Interpreter) until you hit the breakpoint atmain. This permits the stub to complete its third commandexec ./termmines. Theexeccommand is different than normal command execution. Instead of creating a subprocess, it replaces the image of the stub process, so the process is now runningtermmines.Refresh the Modules node in the Objects window. You may need to clear your filter text. Expand the Modules node and verify it lists
termminesinstead ofbash. Without this step, your listings may go out of sync.
At this point, you are attached to your target running in the
terminal, and you have trapped it at main. Because you were
attached to it when it was still bash, you will likely see
a lot of extraneous history. For example, the Modules panel will report
many of the modules that had been loaded by bash. Please
note their lifespans, however. They should correctly indicate those
modules are no longer loaded. In any case, you now have the tools needed
to check your work for this exercise.