A Tour of the Debugger
This module assumes you have completed the Getting Started module. If not, please go back.
This module will briefly introduce each window in the Ghidra Debugger. We assume some familiarity with trap-and-trace debugging. If you have not used GDB or a similar debugger before, you may find the Ghidra Debugger difficult to grasp.
If you would like your tool to look more or less like the one
presented in the screenshots here, launch termmines from
the Debugger using GDB.
The Debugger Tool
Like the CodeBrowser tool, the Debugger tool is a preconfigured
collection of plugins and panels that present Ghidra’s dynamic analysis
features. You may re-configure, save, export, import, etc. the tool to
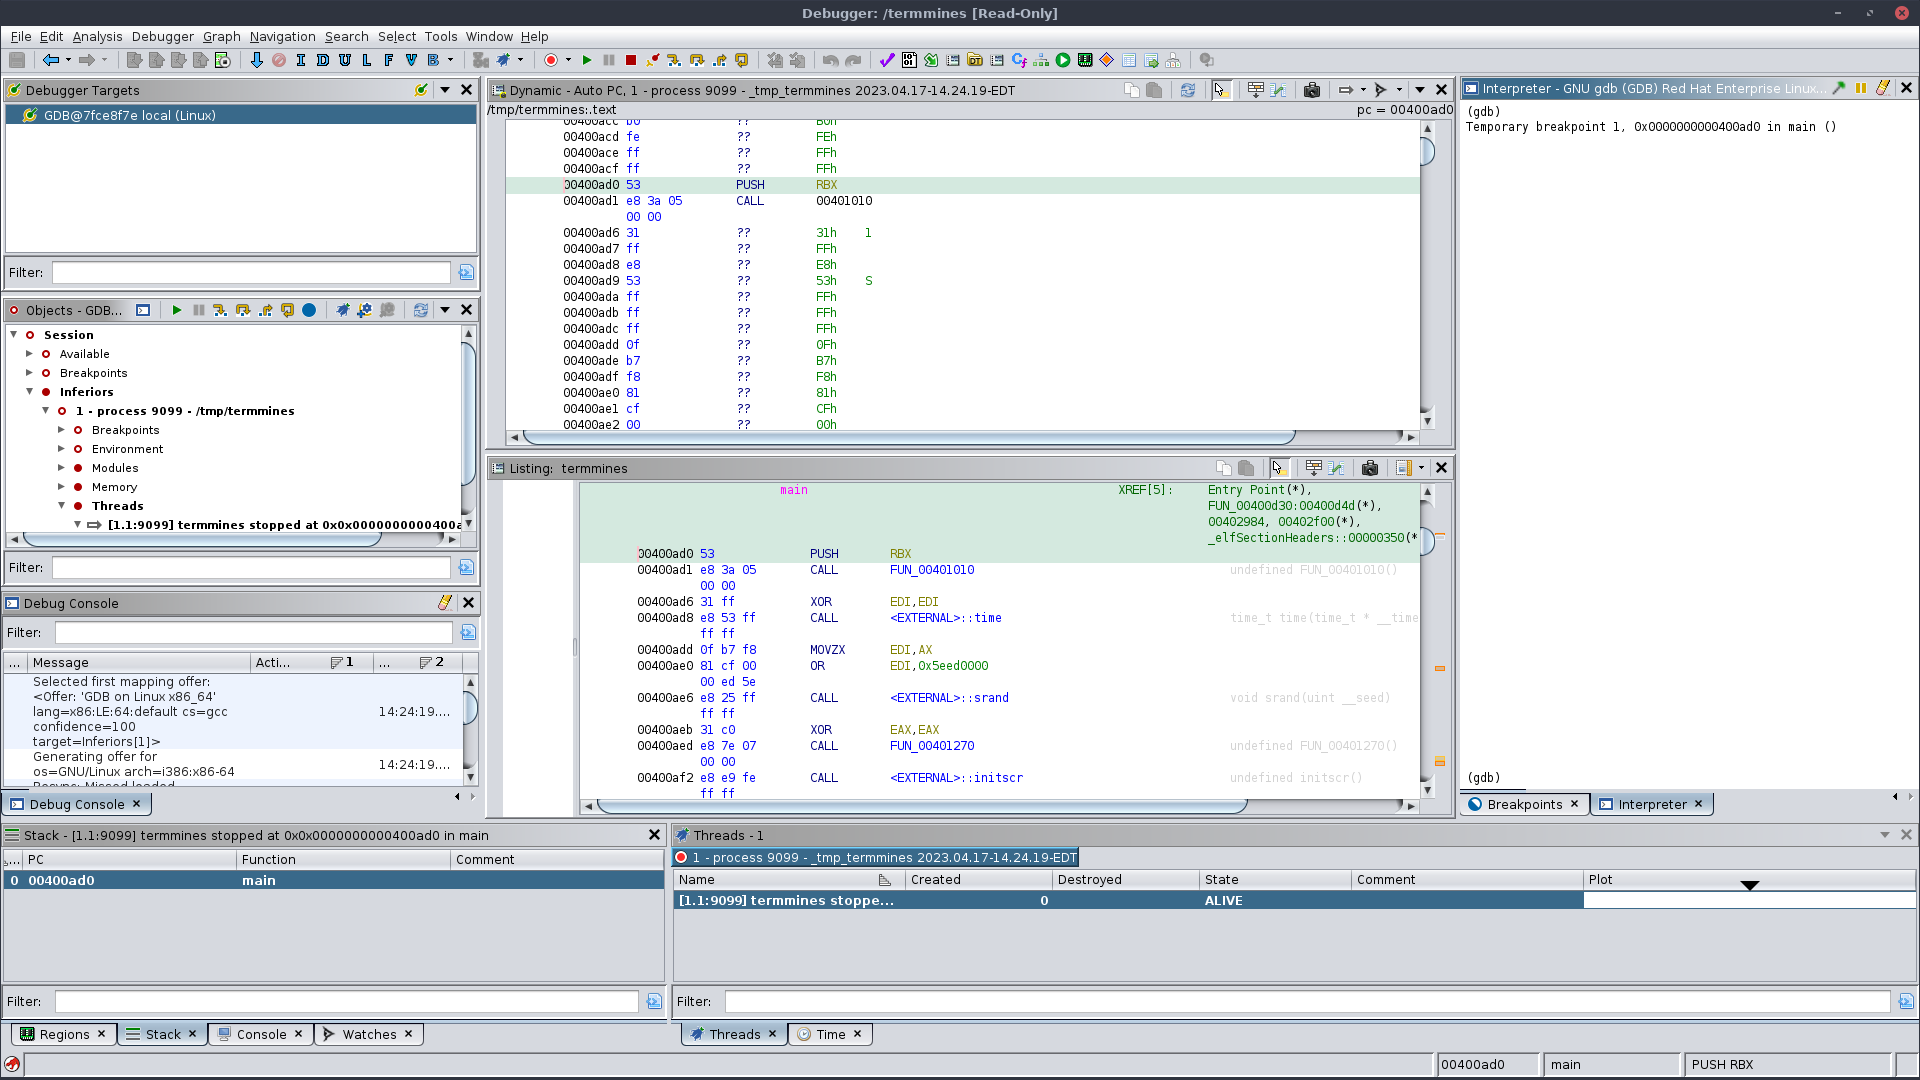
fit your preferences. For reference, here is a screenshot of the default
configuration after launching termmines:
Toolbar
Many of the buttons in the global toolbar are the same as in the CodeBrowser. Coincidentally, in the screenshot, the debugger-specific buttons start just above the Dynamic Listing in the global toolbar. They are:
 Emulate: To be covered in a later module. This will
load the current program (from the Static Listing) into the
emulator.
Emulate: To be covered in a later module. This will
load the current program (from the Static Listing) into the
emulator. Debug: This launches the current program (from the
Static Listing) using a suitable back-end debugger. The drop-down menu
provides a selection of suitable back-end connectors. Clicking the
button will use the last successful connector or the default.
Debug: This launches the current program (from the
Static Listing) using a suitable back-end debugger. The drop-down menu
provides a selection of suitable back-end connectors. Clicking the
button will use the last successful connector or the default. Control
Mode: This drop-down menu sets the mode of the controls and
machine state edits. By default, all actions are directed to the
back-end debugger.
Control
Mode: This drop-down menu sets the mode of the controls and
machine state edits. By default, all actions are directed to the
back-end debugger. Resume: Resume execution. This is equivalent to
continuein GDB. Interrupt: Interrupt, suspend, pause, break, etc. This
is equivalent to Ctrl-C or
Interrupt: Interrupt, suspend, pause, break, etc. This
is equivalent to Ctrl-C or interruptin GDB. Kill: Kill, terminate, etc. This is equivalent to
killin GDB. Disconnect: Disconnect from the back-end debugger.
Typically, this will also end the session. It is equivalent to
Disconnect: Disconnect from the back-end debugger.
Typically, this will also end the session. It is equivalent to
quitin GDB. Step Into,
  Step Over,
  Step
Out,
Step
Out,  Step Last: These buttons step in various ways. In
order, the equivalent commands in GDB are
Step Last: These buttons step in various ways. In
order, the equivalent commands in GDB are stepi,nexti, andfinish. Step Last has no equivalent in GDB; it is meant to repeat the last custom/extended step.
Windows
Starting at the top left and working clockwise, the windows are:
- The Debugger Targets window: This lists active sessions or connections. From here, you can establish new sessions or terminate existing sessions.
- The Dynamic Listing window: This is the primary
means of examining the instructions being executed. By default, it
follows the program counter and disassembles from there until the next
control transfer instruction. It supports many of the same operations as
the Static Listing, including patching. The nearest equivalent in GDB is
something like
x/10i $pc. - The Interpreter window: This is essentially a terminal emulator providing a command-line interface to the back-end debugger. It is useful for diagnostics or for issuing commands that do not have a button in the GUI. Some may also prefer to command the debugger from here rather than the GUI.
- The Breakpoints window: This is stacked below the
Interpreter. It lists and manages the breakpoints among all open images
and running targets. The nearest equivalent in GDB is
info break. - The Registers window: This is stacked below the
Breakpoints window. It displays and edits the register values for the
current thread. The nearest equivalent in GDB is
info registers - The Modules window: This is stacked below the
Registers window. It displays the images (and sections, if applicable)
loaded by the target. The equivalent in GDB is
maintenance info sections. Note that this differs from the Regions window. - The Threads window: This lists the threads in the
current target. The tabs at the top list the active targets. The nearest
equivalents in GDB are
info threadsandinfo inferiors. - The Time window: This is stacked below the Threads window. This lists the events and snapshots taken of the current target.
- The Stack window: This lists the stack frames for
the current thread. The equivalent in GDB is
backtrace. - The Watches window: This is stacked below the Stack
window — pun not intended. It manages current watches. These are
not watchpoints, but rather expressions or variables whose
values to display. To manage watchpoints, use the Breakpoints window or
the Interpreter. The nearest equivalent in GDB is
display. - The Regions window: This is stacked below the
Watches window. It lists memory regions for the current target. It
differs from the Modules window, since this includes not only
image-backed regions but other memory regions, e.g., stacks and heaps.
The equivalent in GDB is
info proc mappings. - The Debug Console window: (Not to be confused with the Console window from the CodeBrowser.) This displays logging messages and problems encountered during a session. Some problems are presented with remedial actions, which may expedite your workflow or aid in troubleshooting.
- The Objects window: This models the back-end debugger as a tree of objects and provides generic actions on those objects. It is generally more capable, though less integrated, than the GUI, but not quite as capable as the Interpreter. It is useful for troubleshooting and for advanced use cases.
Controlling the Target
The control buttons are all located on the global toolbar. Start by
pressing the Step Into
button. Notice that the Dynamic Listing moves forward a single
instruction each time you press it. Also notice that the Static Listing
moves with the Dynamic Listing. You may navigate in either listing, and
so long as there is a corresponding location in the other, the two will
stay synchronized. You may also open the Decompiler just as you would in
the CodeBrowser, and it will stay in sync, too.
When you have clicked Step Into a sufficient number of times, you should
end up in a subroutine. You can click Step Out to leave the subroutine. Note that the target
is allowed to execute until it returns from the subroutine; it does not
skip out of it. Now, click Step Over until you reach another CALL
instruction. Notice that when you click Step Over again, it will not descend into the
subroutine. Instead, the target is allowed to execute the entire
subroutine before stopping again — after the CALL
instruction.
If you prefer, you may use the GDB commands from the Interpreter
instead of the buttons. Try si and/or ni. You
can also pass arguments which is not possible with the buttons,
e.g. si 10 to step 10 instructions in one command.
If you need to terminate the target you should use the Disconnect button rather
than the Kill button, in general. Otherwise, each launch will create a
new connection, and you will end up with several stale connections.
Additionally, if your target exits or otherwise terminates on its own,
you will get a stale connection. Use the Targets window to clean such
connections up. The re-use of connections and/or the use of multiple
concurrent connections is not covered in this course.
Troubleshooting
The listings are not in sync, i.e., they do not move together.
First, check that synchronization is enabled. This is the default behavior, but, still, check it first. In the top-right of the Dynamic Listing is its local drop-down menu. Click it and check that Auto-Sync Cursor with Static Listing is selected.
If that does not work, check the top-left label of the Dynamic
Listing to see what module you are in. Also check the Debug Console
window. If you are in a system library, e.g., ld-linux,
then this is the expected behavior. You may optionally import it, as
suggested by the Debug Console, but this is covered later.
If you are not in a system library, then check the Modules window to
see if termmines is listed. If so, it seems the module
mapper failed to realize that module is the current program. Right-click
the module and select “Map to termmines.” Confirm the dialog. If
termmines is not listed, then your version of GDB may not
be supported. If you file a bug report, please include your GDB version,
Linux distribution, and/or other platform details.
The listings seem to move together, but their contents differ.
There is probably a discrepancy between the version you imported and
the version you launched. This should not happen with
termmines, but perhaps you re-ran make between
importing and launching? For other system libraries, this could happen
if you or an administrator applied system updates since you imported.
You probably need to re-import the affected module image(s). If this
happens to you in practice, and you have substantial investment in the
old import, consider using the Version Tracker to port your knowledge to
the new import.
I can step, but I don’t see the effects in the Interpreter window.
This can happen if the Control Mode is set to the Emulator. Change the Control Mode back to “Control Target.”
Exercise: Step Around
If you were not already following along with an instructor, then try
some of the stepping buttons. One of the first subroutines called in
termmines parses command-line arguments. Try stepping until
you have entered that subroutine. TIP: Use the
Decompiler to help you recognize when you have entered the command-line
parsing subroutine. Alternatively, use the Static Listing and Decompiler
to identify the parsing subroutine (as you would in the CodeBrowser),
and then use the Step buttons to drive the target into it.