Remote Targets
This is the first module of the Advanced part of this course. It assumes you have completed the Beginner portion. At the very least, you should complete Getting Started and A Tour of the Debugger UI first.
Module Mapping Caveats
Beware! Many of the conveniences in Ghidra assume that the target is running from the same file system as Ghidra, which will not be the case when the target is remote. Be sure your current project is populated only with programs imported from the target’s file system. Additionally, if prompted to import something new, be sure to redirect to the remote file system, because the dialog will default to the path on the local file system.
Variation in Configuration
There are a number of configurations for remote debugging with many moving parts. Some of those parts are contributed by Ghidra’s Debugger, some are not. Depending on your particular target and platform, there may be several options available to you. Consider a remote Linux target in user space. While this list is not exhaustive, some options are:
- Use
gdbserver - Use SSH
- Use GADP
- Use a pty
Generally, for each of these options it boils down to which components will be colocated with the target and which will be colocated with Ghidra.
Using gdbserver
In this configuration, Ghidra and GDB will be located in the user’s
local environment, while gdbserver and the specimen will be
located in the target environment. The procedure follows directly from
GDB’s manual, but with some Ghidra-specific steps. First, prepare the
target, which for demonstration purposes has the IP address
10.0.0.1:
gdbserver 10.0.0.1:12345 termminesThen, connect from Ghidra using GDB:
From the Targets window, click Connect, select “gdb,” and click Connect.
In the Interpreter, do as you would in GDB:
target remote 10.0.0.1:12345
The target should now be added to the Debugger session, and things should work as usual.
Using SSH
In this configuration, only Ghidra is required to be in the user’s
local environment, while sshd, gdb and the
specimen will be located in the target environment.
NOTE: The full gdb, not just
gdbserver, must be installed on the target system.
From the Targets window, click Connect, and select “gdb via SSH.”
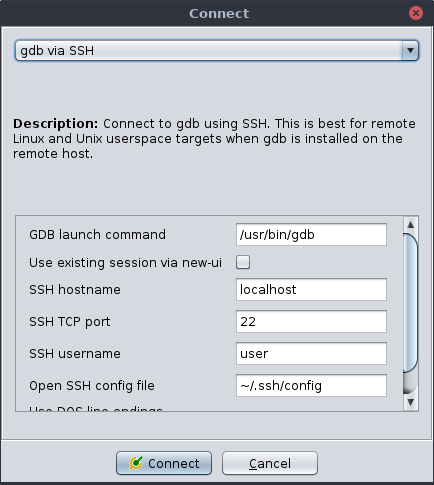
Set “GDB launch command” to the path of gdb on the remote file system.
Leave “Use existing session via new-ui” unchecked.
Set “SSH hostname” to the name or IP address of the target system.
If you are not using the standard SSH port, set “SSH TCP port” accordingly.
Set “SSH username” to your username on the target system.
Set “Open SSH config file” to the client config file on the local file system.
If the remote uses DOS line endings (unlikely for a Linux remote), then check the “Use DOS line endings” box.
Click Connect.
If prompted, enter your SSH credentials.
If everything goes well, the Objects window should populate, and you should get an Interpreter window presenting the remote GDB CLI. You may use it in the usual manner to launch your target. Alternatively, in the Objects window, click the Launch or Quick Launch button to launch the current program. If prompted for the target command line, remember you must provide the path on the remote file system.
The target should now be added to the Debugger session, and things should work as usual.
Using GADP
GADP (Ghidra Asynchronous Debugging Protocol) is a protocol contributed by the Ghidra Debugger. It allows any of Ghidra’s back-end connectors to be deployed as an agent. The agent connects to the back-end as usual, but then opens a TCP socket and waits for Ghidra to connect.
Using GADP Locally
When debugging locally, the UI may offer “GADP” as an alternative to “IN-VM”. If the back-end connector tends to crash Ghidra, you may prefer to select GADP. Typically, GADP will slow things down as information is marshalled across a TCP connection. However, if the connector crashes, Ghidra will simply drop the connection, whereas the IN-VM connector would crash Ghidra, too.
Using GADP Remotely
In this configuration, only Ghidra is required to be in the user’s
local environment. The target environment must have gdb,
java, and some portion of Ghidra installed.
If you can install Ghidra on the remote system, there is a script to launch the headless agent:
cd /path/to/ghidra
support/gdbGADPServerRun -h
This should print help for you. Typically, you can just run the agent without any extra command-line arguments:
support/gdbGADPServerRunIf not, then you probably just need to tell it where you installed
gdb:
support/gdbGADPServerRun --agent-args -g /path/to/bin/gdbIf you cannot install Ghidra, or do not want to, then you can build a standalone jar. You will still need to install the JRE on the target, likely the same version as recommended for Ghidra.
Refer to the root README file to get started with a build from
source. You may stop short of the gradle buildGhidra step,
though it may be helpful to avoid trouble. Then, build the executable
jar for the GDB agent:
gradle Debugger-agent-gdb:nodepJarThis will create the file
Ghidra/Debug/Debugger-agent-gdb/build/libs/Debugger-agent-gdb-nodep.jar.
Copy the file to the target system. Now, run it:
java -jar Debugger-agent-gdb-nodep.jar -hOnce the agent is running, it should print its port number, and you can connect from Ghidra. For demonstration, we will assume it is listening at 10.0.0.2 on port 15432.
- From the Targets window, click Connect.
- Select “Ghidra debug agent (GADP)” from the drop-down.
- For “Agent network address”, enter 10.0.0.2.
- For “Agent TCP port”, enter 15432.
- Click Connect.
That should complete the connection. You should see Objects populated and get an Interpreter window. You can then proceed to launch or attach a target in that connection using either the Objects window or the Interpreter window.
Using a pty (pseudo-terminal)
If your copy of GDB supports the new-ui command (all
versions 8.0 and up should), then you may use any of the GDB connectors
(including the local IN-VM one) to join Ghidra to an existing GDB
session:
Run
gdbfrom a proper terminal:gdb termminesIf needed, do whatever you would like to do before connecting with Ghidra.
In Ghidra, from the Targets window, click Connect, and select
gdb.Check the “Use existing session via new-ui” box.
Click Connect.
You will be prompted with the name of a pseudo terminal, e.g.,
/dev/pts/1.Back in
gdb:new-ui /dev/pts/1
That should complete the connection. If there was a target active in the existing GDB session, Ghidra should recognize it, and things should work as usual. If there was not a target, then you should at least see Objects populated and get an Interpreter window. You can then proceed to launch or attach a target in that connection using either the Objects window or the Interpreter window.
This same checkbox is available in the “gdb via SSH” connector. Note that the remote system must support pseudo terminals, and the name of the pseudo terminal is from the remote file system.
To activate this configuration in the standalone GADP agent, use the
-x option:
java -jar Debugger-agent-gdb-node.jar --agent-args -xRube Goldberg Configurations
While you should always prefer the simpler configuration, it is
possible to combine components to meet a variety of needs. For example,
to debug a native Android target from Windows, you could run Ghidra on
Windows, connect it to GDB via SSH to a Linux virtual machine, e.g.,
WSL2, and then connect that to gdbserver running in an
Android emulator.
Exercise: Debug your Friend’s termmines
If you are in a classroom setting, pair up. Otherwise, play both
roles, preferably using separate machines for Ghidra and the target.
Using either gdbserver, gdb via SSH, or the GDB agent,
debug termmines. One of you should prepare the target
environment. The other should connect to it and launch the specimen.
Then trade roles, choose a different configuration, and do it again.